Mars · Manufacturing
Mars: Breakdown Analysis, Expected to Save At Least €86 Million a Year
Designed Breakdown Analysis from the breakdown list to the confirmed root cause, the site mapping admin page, Downtime in speed mode, and the FMOS admin pages and KPI targets.
- Role
- UX Designer
- Scope
- Breakdown Analysis and FMOS factory tools
- Focus
- Manufacturing
- Designer
 Gideon Awolesi
My contribution · Mars
Breakdown Analysis and FMOS factory tools
The product owner approved my interactive Breakdown Analysis prototype for testing with the European sites from January 2026. Breakdown Analysis is expected to save Mars at least €86 million a year.
- €86M
- expected yearly savings
- 172
- prototype iterations
- Jan 2026
- approved for European site testing
What I owned
- 01Designed Breakdown Analysis in Mendix with the product owner and key users, then built it as an interactive prototype in 172 iterations.
- 02Designed the site mapping admin page and Downtime in speed mode for factories that measure cuts per minute.
- 03Looked after the Mars design system in 2026 and wrote a diagnostic and a governance proposal for it.
Clickable prototypes
Open the Mars prototypes
Each project has its own clickable prototype. Combine breakdowns into an analysis, map functional locations to lines, log downtime in speed mode, or set KPI targets.
Overview
About the project
- Role: Lead product designer at Mars from September 2023 to June 2026, on the Digital MAKE program for the European factories. I joined as the second UX designer, next to the designer who was already on the program. From early 2026, I was the only designer on these products, and I ran the knowledge transfer to the designer from the new delivery partner.
- What it is: Mars runs its European factories on a set of internal tools built in Mendix. FMOS, the Factory Mars Operating System, is the central one. Shift teams log their KPIs, downtime, and safety checks in it. BPS is the problem-solving tool: a deviation from a KPI gets actions, and if the team can't solve it at their level, it's escalated up the CP levels. Breakdown Analysis is the tool reliability engineers use to find the root cause of a machine breakdown. In 2025, it was still a Power Apps app, and Mars decided to rebuild it in Mendix next to BPS.
- Outcome: I designed screens across FMOS, BPS, and Breakdown Analysis, and I built an interactive Breakdown Analysis prototype that the product owner approved for testing with the European sites from January 2026. In 2026, I went back to the original screens and rebuilt the three products as one clickable coded prototype.
Project overview
- What Mars runs its factories on: Mars builds its factory apps in Mendix. FMOS, the Factory Mars Operating System, is the central one, where shift teams log their KPIs and run their CP meetings. BPS is the problem-solving tool for process deviations. Breakdown Analysis is the tool reliability engineers use to find the root cause of a technical machine breakdown. In 2025, Breakdown Analysis was still a Power Apps app, and Mars decided to rebuild it in Mendix next to BPS.
- What I did: I joined the Digital MAKE team in July 2025 as a UX designer, next to the designer who already owned the design system and the FMOS visuals. My first projects were in FMOS: the admin pages and the Downtime app. From October 2025, I owned the design of the new Breakdown Analysis app. After the other designer left the team in early 2026, I looked after the design system on my own, and when the delivery partner changed, I ran the knowledge transfer to the new partner's designer.
- Outcome: The BDA product owner approved my December 2025 Breakdown Analysis prototype, which took 172 iterations, for testing with European sites from January 2026. Breakdown Analysis is expected to save Mars at least €86 million a year.
Prototypes
These were separate projects, so each one has its own tab below. Four of them have an interactive prototype. The other three tabs cover work I supported, or work that a prototype wouldn't show well.
I built the prototypes in 2026 from the meeting notes and the original screens. Mars didn't commission them, and they run on sample data built on the real Slough lines and functional locations, so they aren't Mars's production software.
Breakdown Analysis
Interactive prototype: Open the prototype. Try this: Select the three Transfer conveyor 3 breakdowns and press Combine and start BDA, then work through the 5 Why to a root cause.
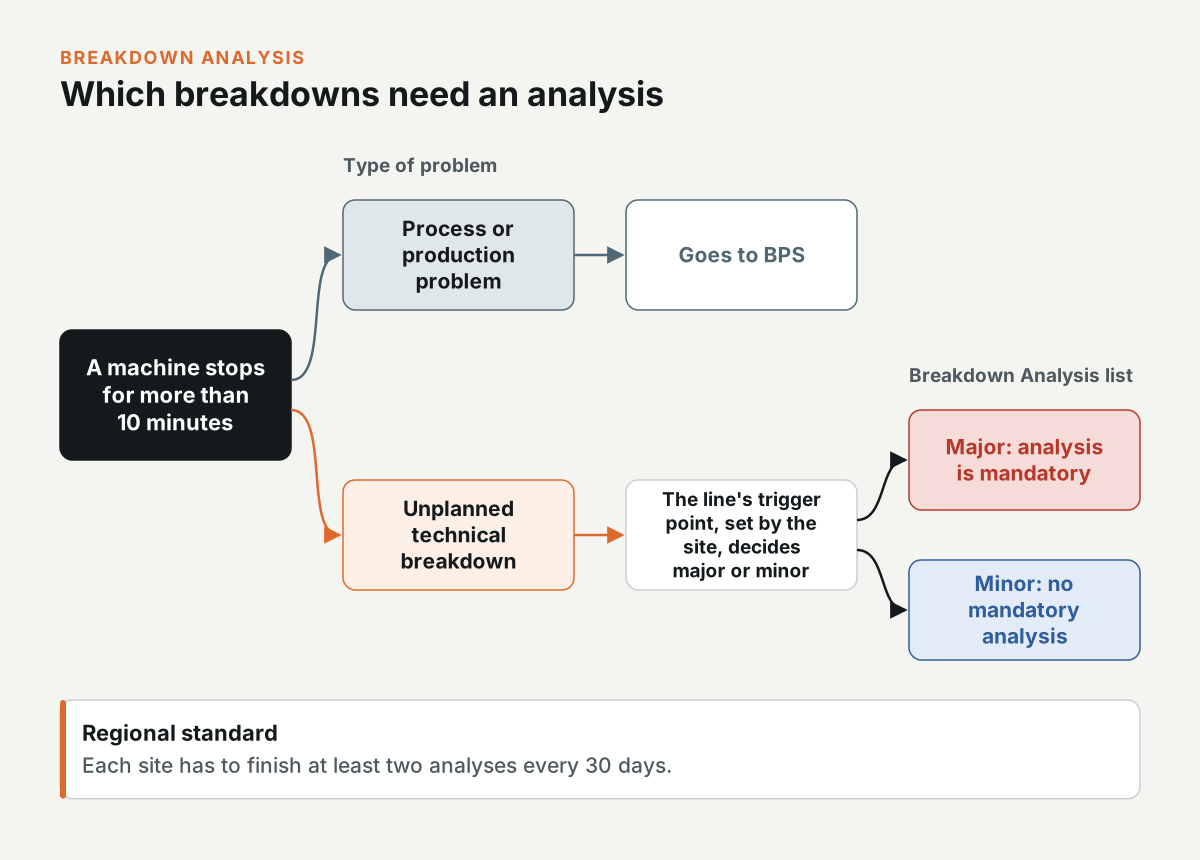
Reliability engineers and maintenance teams use Breakdown Analysis to analyse unplanned technical breakdowns, where a machine stops for more than 10 minutes, and to find the root cause. Process and production problems go to BPS instead. Under the regional standard, each site has to finish at least two analyses every 30 days. Each site sets a trigger point for each line, which decides if a breakdown is major or minor, and only the majors need a mandatory analysis.
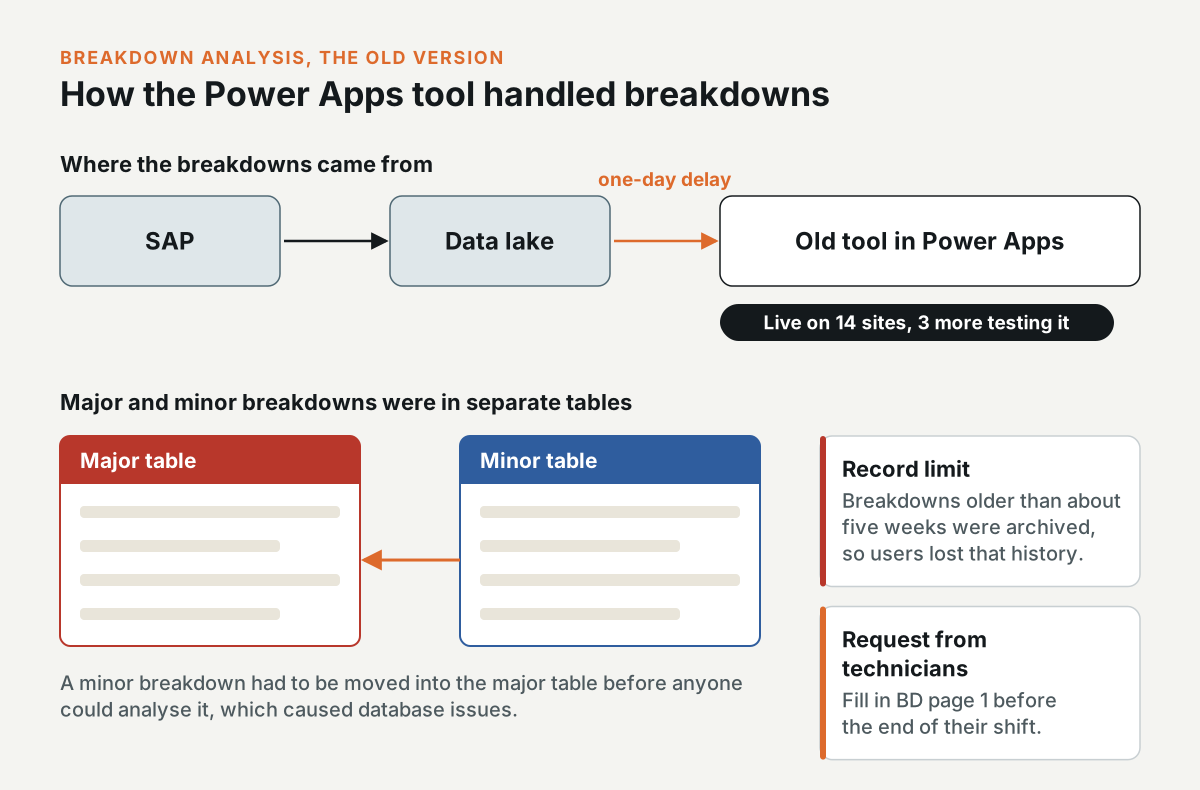
The old version ran in Power Apps, live on 14 sites with 3 more testing it. Breakdowns came from SAP through the data lake with a one-day delay. Power Apps has a record limit, so breakdowns older than about five weeks were archived, and users lost that history. Major and minor breakdowns were in separate tables, and a minor breakdown had to be moved into the major table before anyone could analyse it, which caused database issues. Technicians had also asked to fill in BD page 1, the first page of the analysis, before the end of their shift.
A previous designer had started mockups in 2025 and didn't finish them. From October 2025, I owned the design of the new Mendix app. I ran weekly design sessions with the BDA product owner, who was the global owner of the tool, and a big part of the job was capturing his knowledge of the process in the design.
Research with the product owner and key users
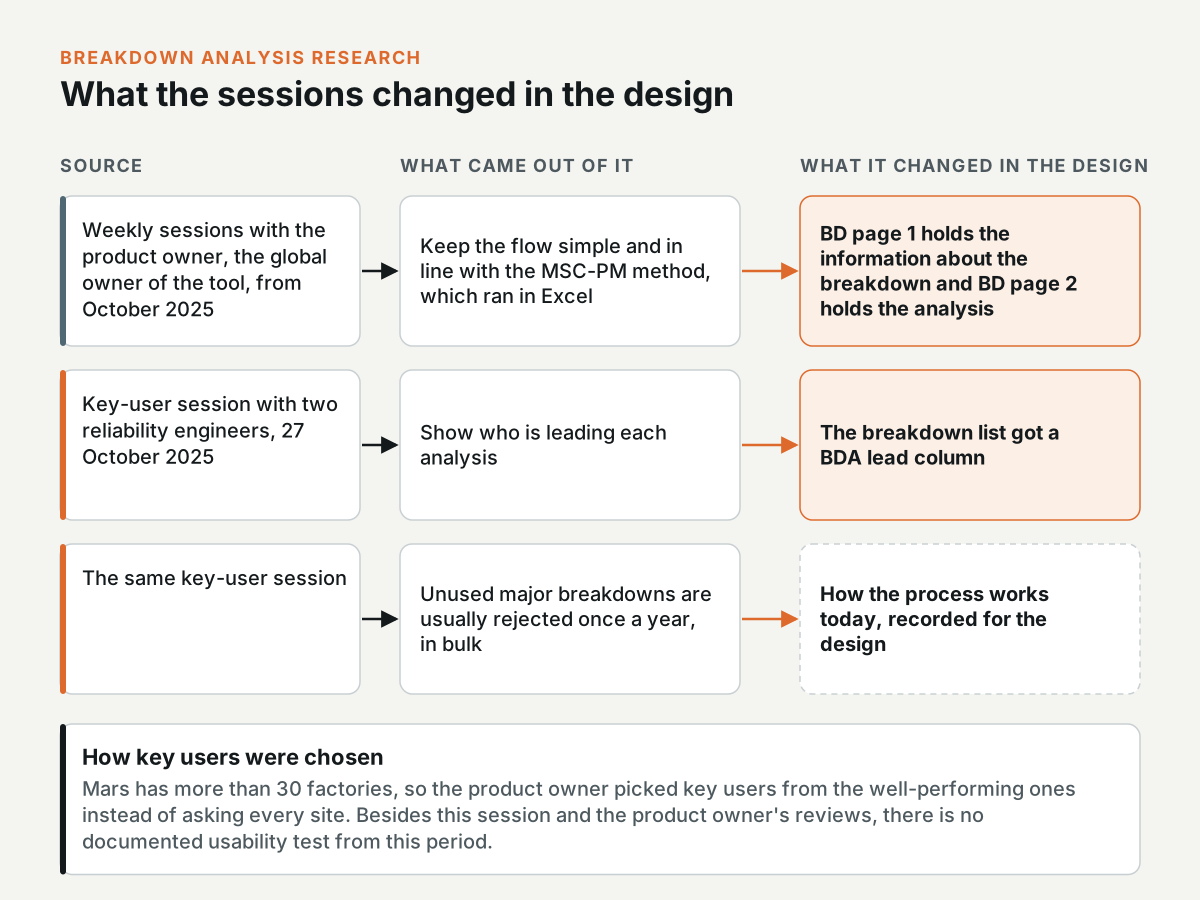
From October 2025, I had access to the old tool in a test environment, and the product owner walked me through the process in the weekly sessions. Mars teams use the MSC-PM method, which ran in Excel, with BD page 1 for the information about the breakdown and BD page 2 for the analysis. The product owner asked me to keep the new flow simple and in line with that method.
On 27 October 2025, I ran a key-user session with two reliability engineers. One of them had been at Mars for 14 years and was on the team that set up the original BDA process. They asked to see who's leading each analysis, so the breakdown list got a BDA lead column. They also explained that they usually reject the unused major breakdowns once a year, in bulk.
Mars has more than 30 factories, so the product owner picked key users from the well-performing ones instead of asking every site. Besides that session and the product owner's reviews, there isn't a documented usability test from my time on the project.
How the analysis flow works
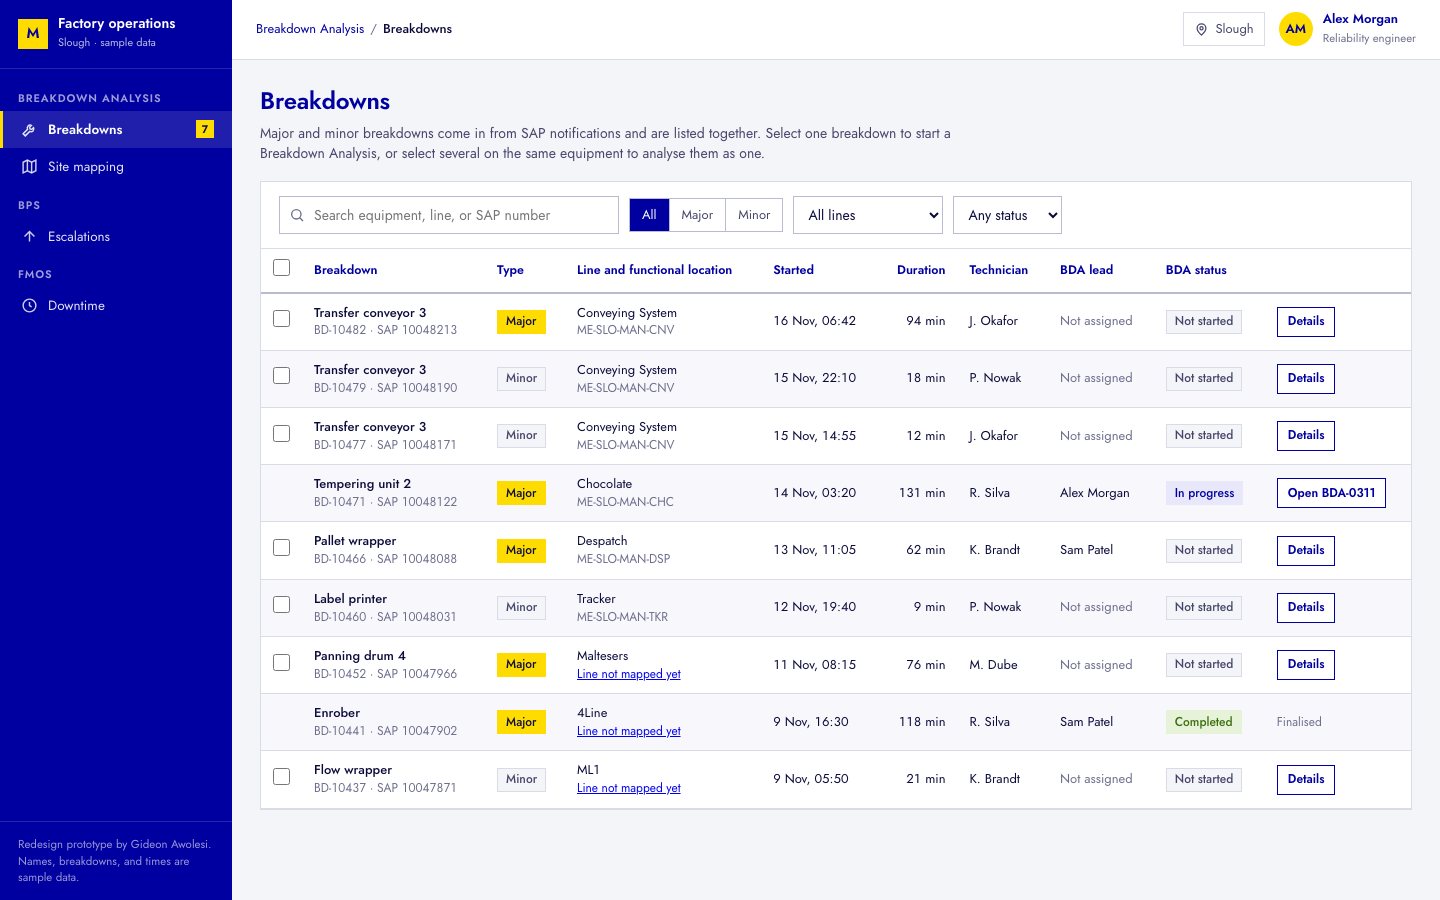
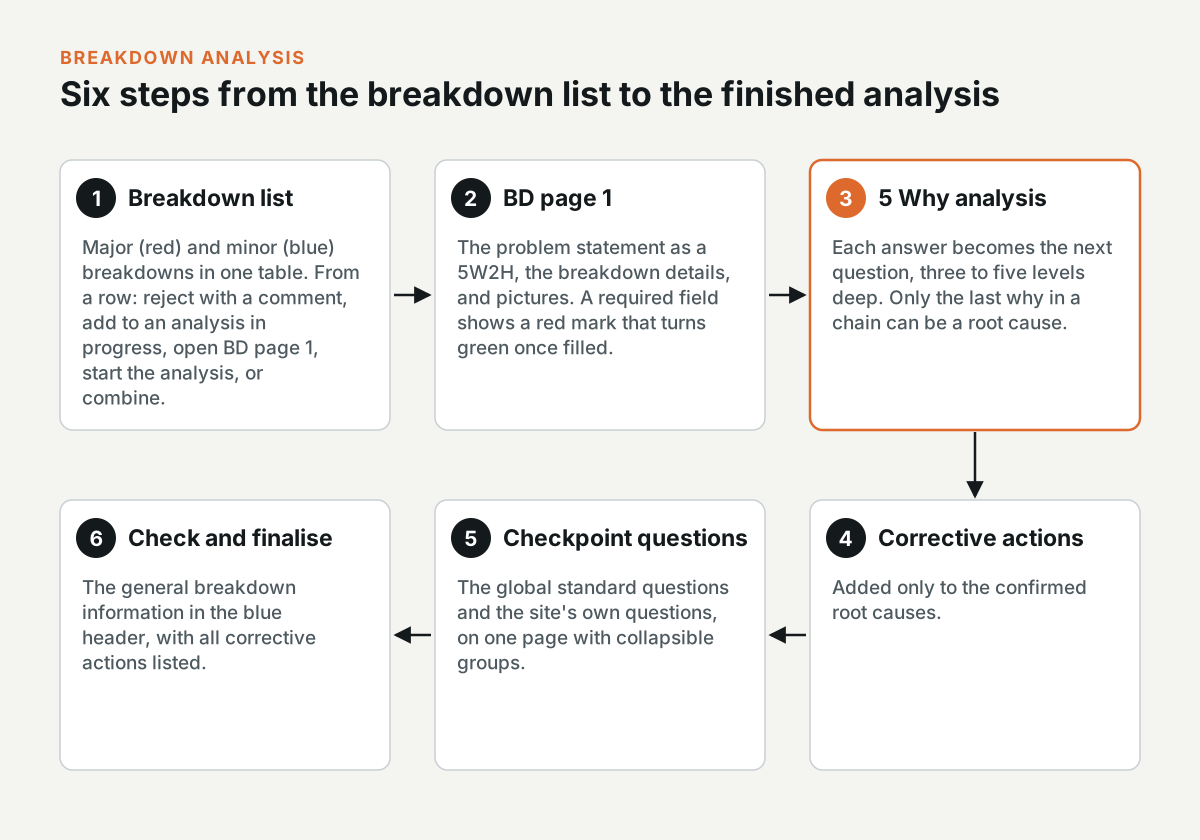
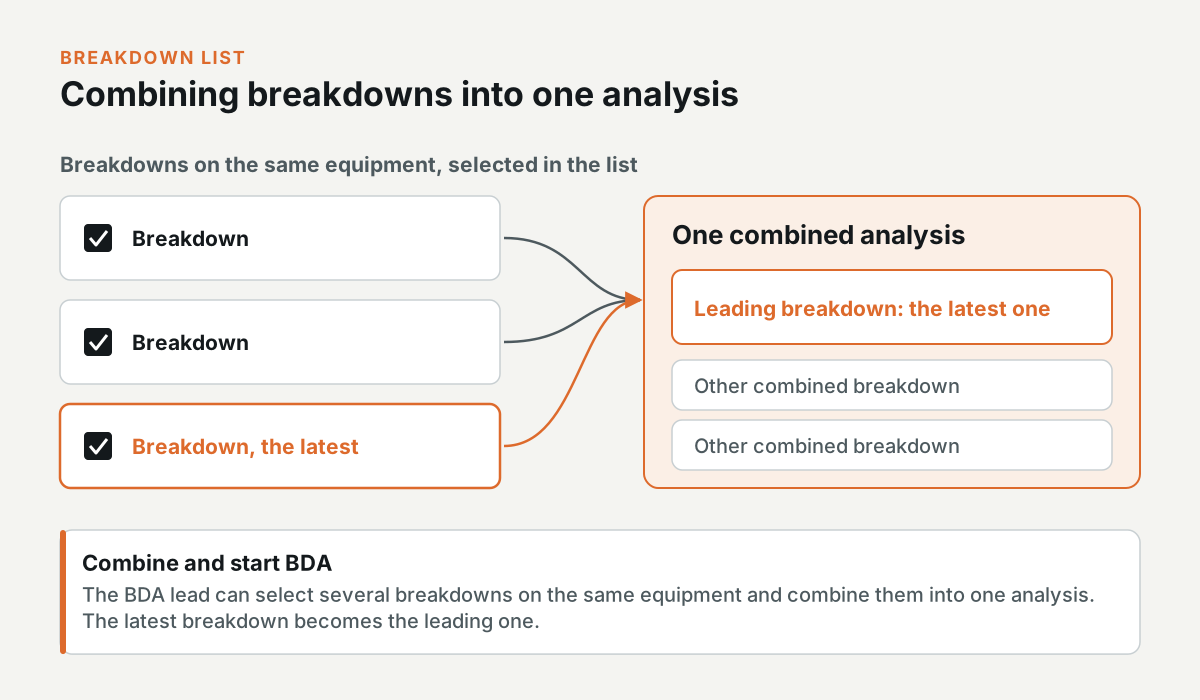
The analysis starts from the breakdown list, where major and minor breakdowns are in one table. Red marks a major breakdown and blue marks a minor one. From a row, the BDA lead can reject the breakdown with a mandatory comment, add it to an analysis that's already in progress, open BD page 1, or start the analysis straight away. The lead can also select several breakdowns on the same equipment and combine them into one analysis, and the latest breakdown becomes the leading one.
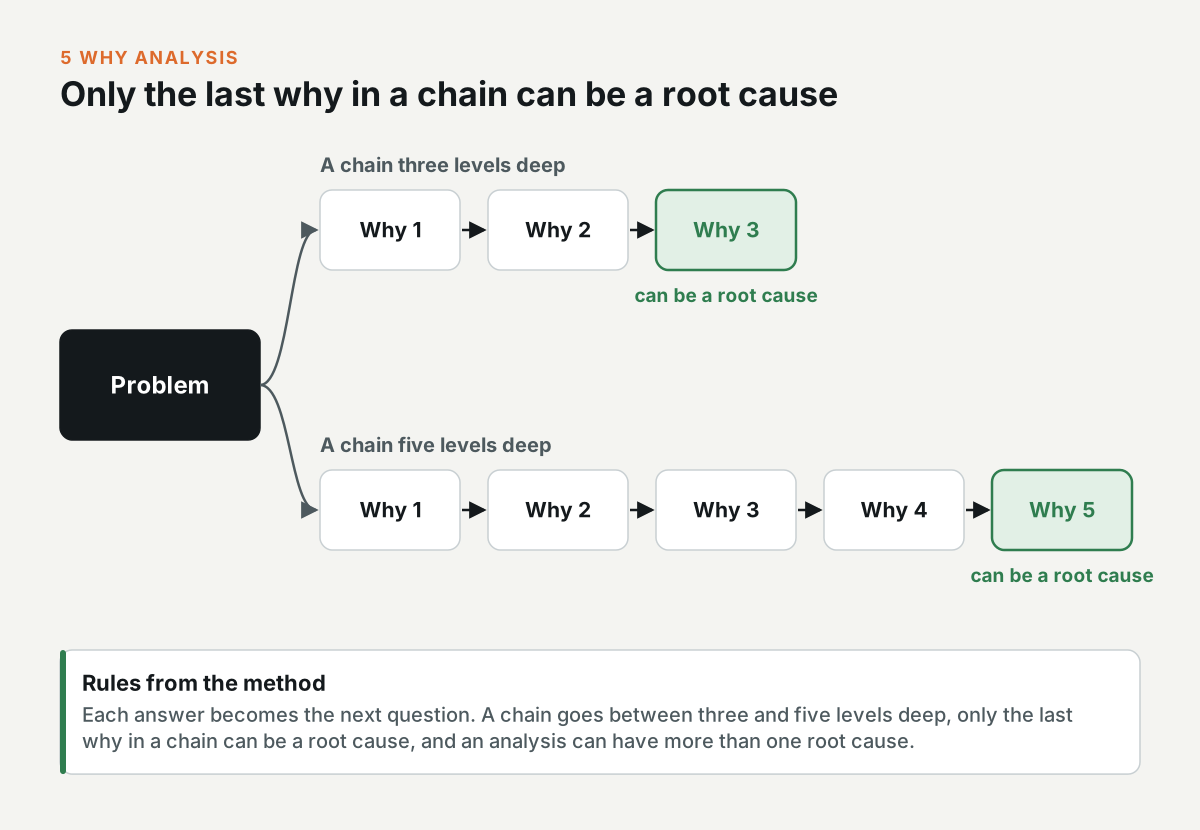
On BD page 1, the team writes the problem statement as a 5W2H and adds the breakdown details and pictures. A required field has a red exclamation mark that turns green once it's filled, and a confirmation shows when the page is complete. In the 5 Why analysis, the team starts from the problem and asks why, and each answer becomes the next question. A chain can go between three and five levels deep, and only the last why in a chain can be a root cause, because that's the rule in the method. An analysis can have more than one root cause.
Corrective actions are added only to the confirmed root causes. After that, the team answers the standard checkpoint questions, which are the same globally, and the site's own questions, on one page with collapsible groups. The last step is the check and finalise page, with the general breakdown information in the blue header and all the corrective actions listed.
The design decisions and the reasons for them
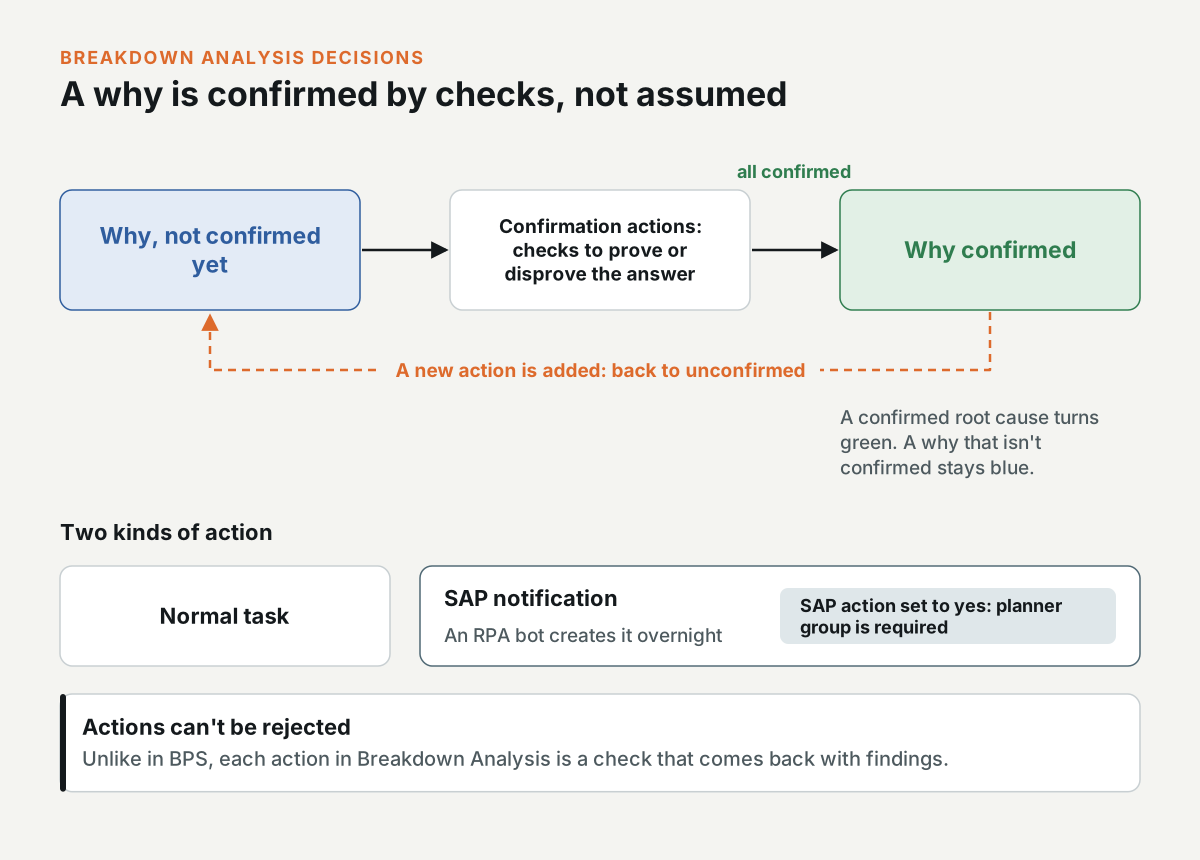
In the old process, people often assumed a root cause without checking it. So each why can have confirmation actions, which are checks to prove or disprove that answer. A why is confirmed once all its confirmation actions are confirmed, and if someone adds a new action after that, it goes back to unconfirmed. A confirmed root cause turns green, and a why that isn't confirmed yet stays blue.
Actions in Breakdown Analysis can't be rejected, unlike in BPS, because each one is a check that comes back with findings. An action can be a normal task or an SAP notification, which an RPA bot creates overnight. When the team switches SAP action to yes, the planner group becomes a mandatory field.
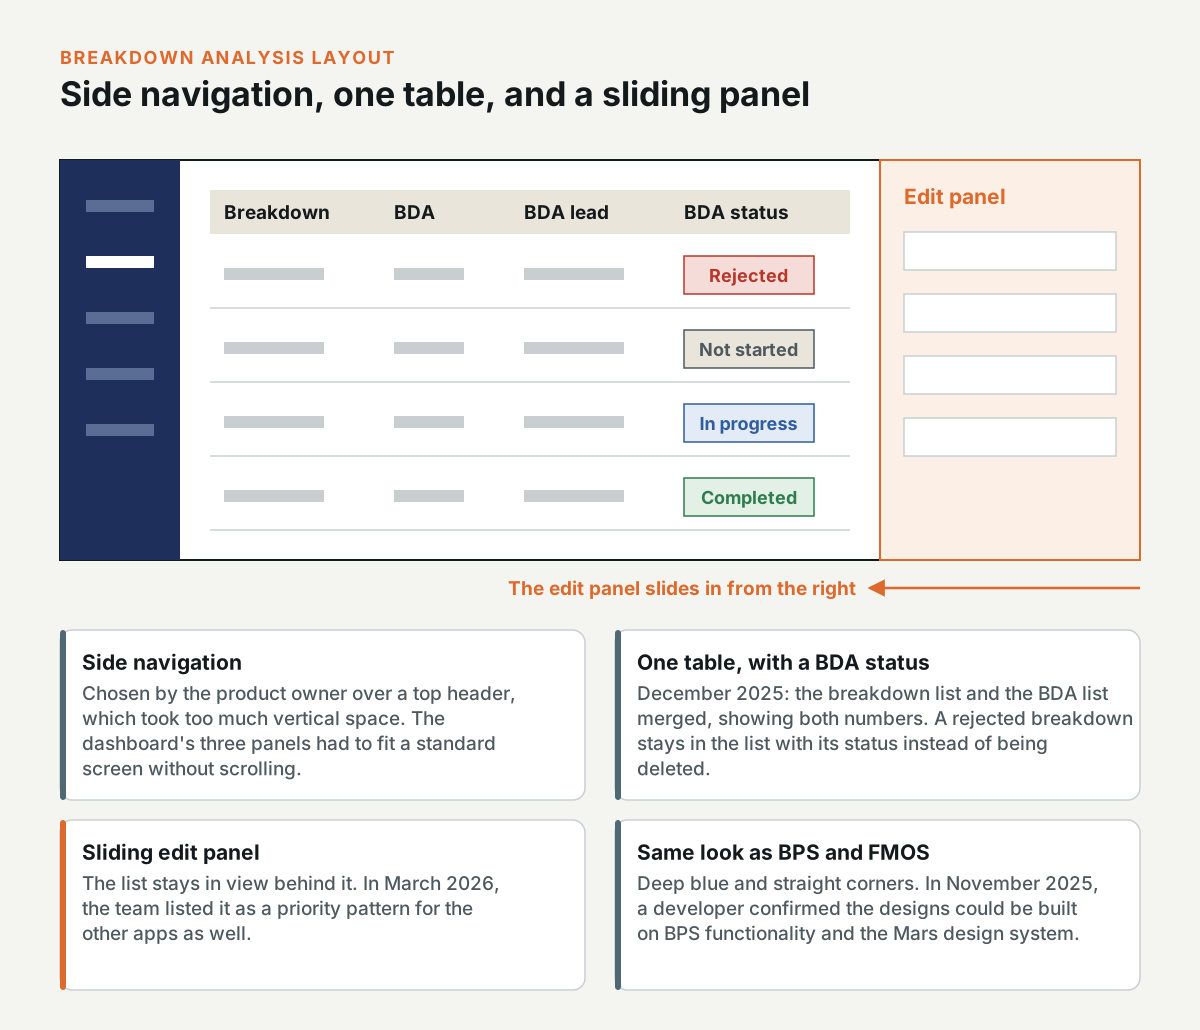
The product owner chose a side navigation over a top header, because the header took up too much vertical space, and the dashboard's three panels had to fit on a standard screen without scrolling. Editing happens in a panel that slides in from the right, and the list stays in view behind it. In March 2026, the team listed that sliding panel as a priority pattern for the other apps as well.
In December 2025, I merged the breakdown list and the BDA list into one table that shows both the breakdown numbers and the BDA numbers. The BDA started column became BDA status, with four values: Rejected, Not started, In progress, and Completed. This way, a rejected breakdown stays in the list with its status, instead of being deleted.
The same users work in FMOS and BPS on the days they run an analysis, so I kept the components in line with BPS and the FMOS look, with deep blue and straight corners. In November 2025, a developer reviewed the designs and confirmed they could be built on the BPS functionality and the Mars design system.
The prototype and what happened next
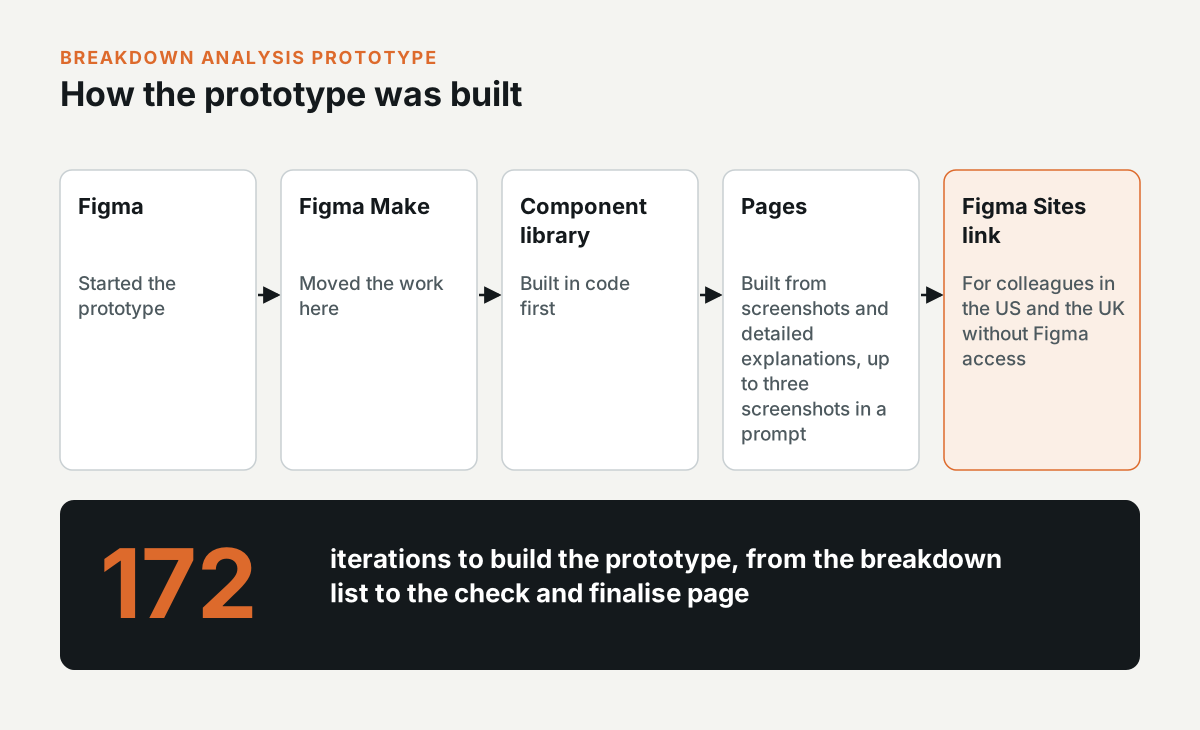
I started the prototype in Figma and then moved to Figma Make. I built a component library in code first, and then built each page from screenshots and detailed explanations, with no more than three screenshots in a prompt. The prototype took 172 iterations, from the breakdown list to the check and finalise page. I published it as a Figma Sites link, because colleagues in the US and the UK didn't have Figma access and still needed to click through it.
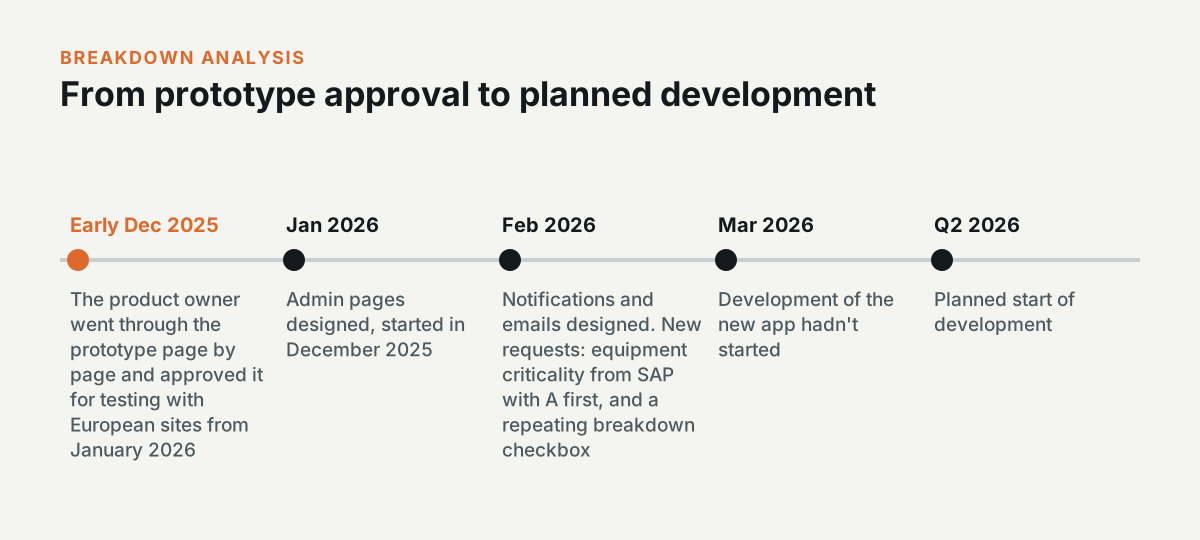
In early December 2025, the product owner went through the prototype page by page and approved it for testing with European sites from January 2026.
After the approval, I designed the admin pages, and in February 2026 the notifications and emails. That month, the product owner also asked for the equipment criticality from SAP, with A first, and for a repeating breakdown checkbox. Development of the new app was planned for the second quarter of 2026, and it hadn't started by March 2026.
BDA admin pages and site mapping
Interactive prototype: Open the prototype. Try this: Open BARS, add a line, and move unassigned functional locations onto it. A location can only belong to one line.
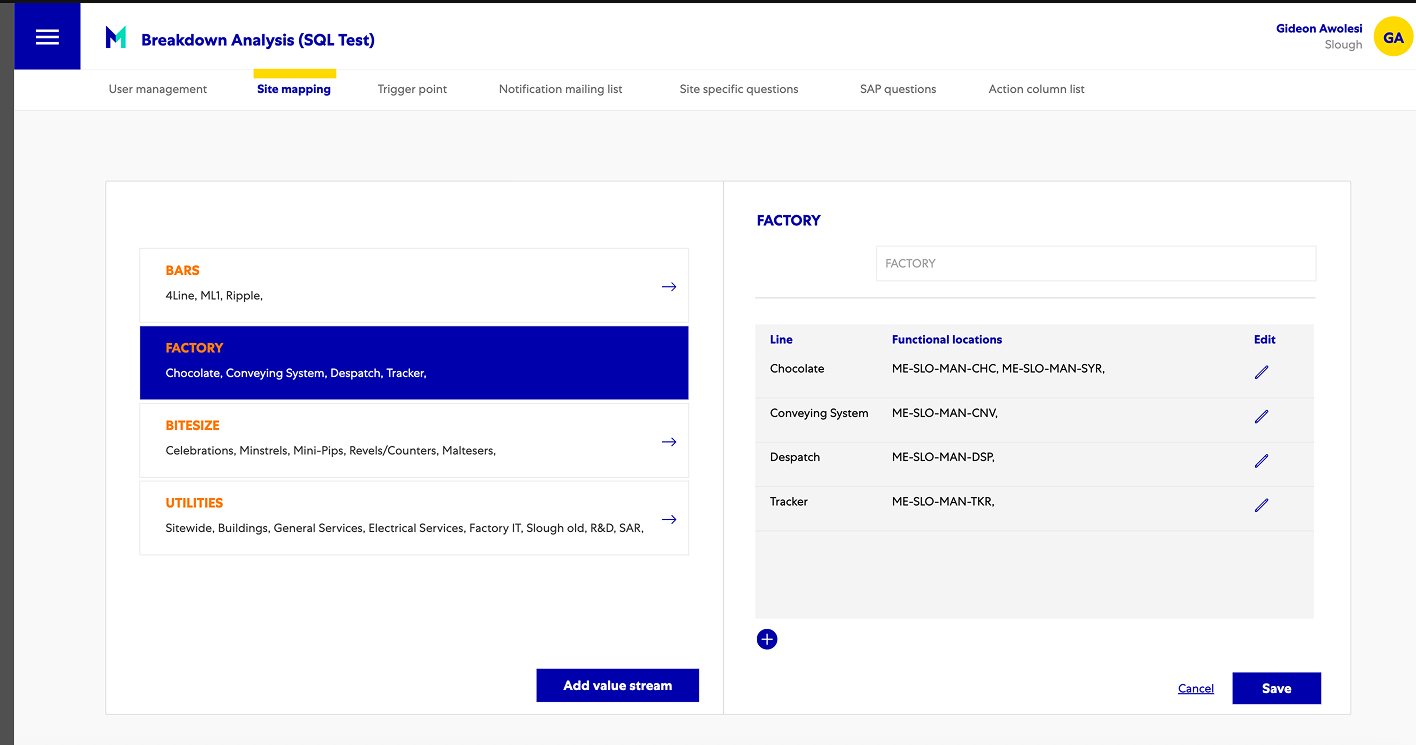
Each site sets up Breakdown Analysis in the admin pages. The Power Apps version had seven tabs: user management, site mapping, trigger point, notification mailing list, site-specific questions, SAP questions, and the action column list.
Site mapping connects SAP to the factory lines. A value stream, like Factory, holds lines, like Chocolate or Conveying System, and each line is mapped to its SAP functional locations, like ME-SLO-MAN-CNV. Breakdown Analysis uses that mapping to put a breakdown reported on a functional location onto the right line.
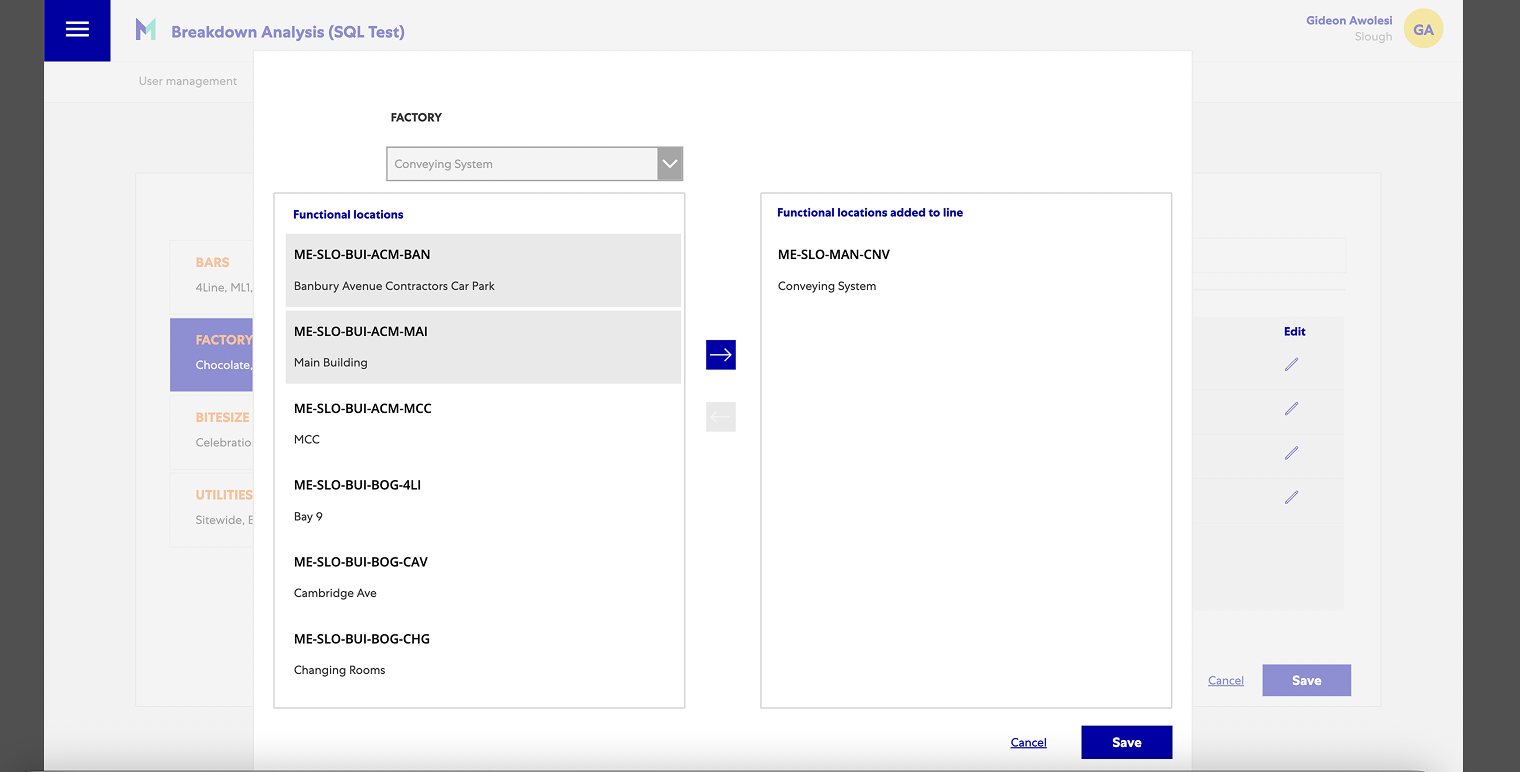
In the old tool, you selected a value stream, pressed the pencil on a line, picked functional locations in the left list of a dual list, moved them across with an arrow, saved the modal, and then saved the page. The dual list already allowed multi-select. The issue was the size of the list. A factory has 150 to 200 functional locations, and the admin scrolled through all of them in the left list of the modal.
What the product owner asked for
I owned the design of the admin pages from December 2025 to January 2026. On 14 January 2026, I took the product owner through every admin section, and he shared his screen to show how sites use the current tool.
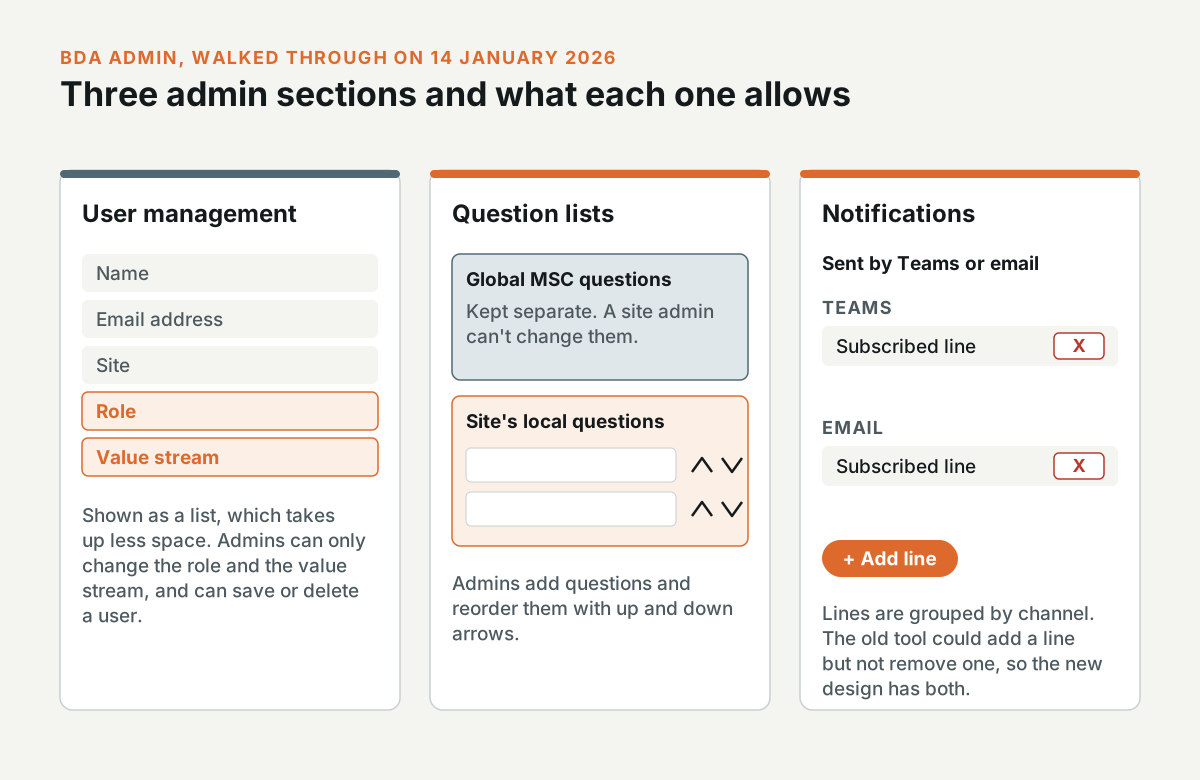
User management became a list with the name, email address, site, role, and value stream of each user, because a list takes up less space. Admins can only change the role and the value stream, and they can save or delete a user.
For the question lists, admins add questions and reorder them with up and down arrows. The global MSC questions are kept separate from the site's local questions, and a site admin can't change the global ones.
Notifications go out by Teams or email. Each person has a list of the lines they're subscribed to, grouped by channel. In the old tool, admins could add a line to that list but couldn't remove one, so the new design has both.
How site mapping changed
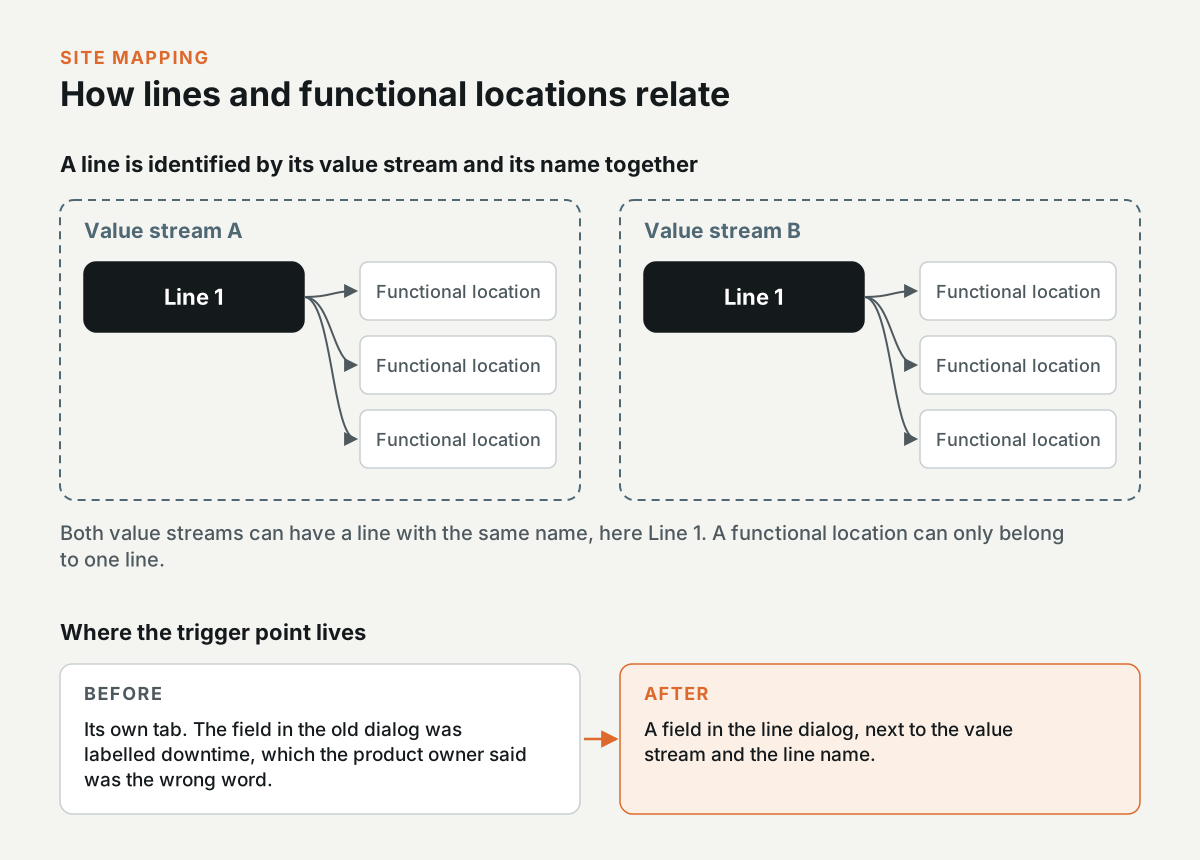
The trigger point moved onto the line. It used to have its own tab, and the field in the old dialog was labelled downtime, which the product owner said was the wrong word. Now the trigger point is a field in the line dialog, next to the value stream and the line name.
Two value streams can each have a line with the same name, but a functional location can only belong to one line. So a line is identified by its value stream and its name together.
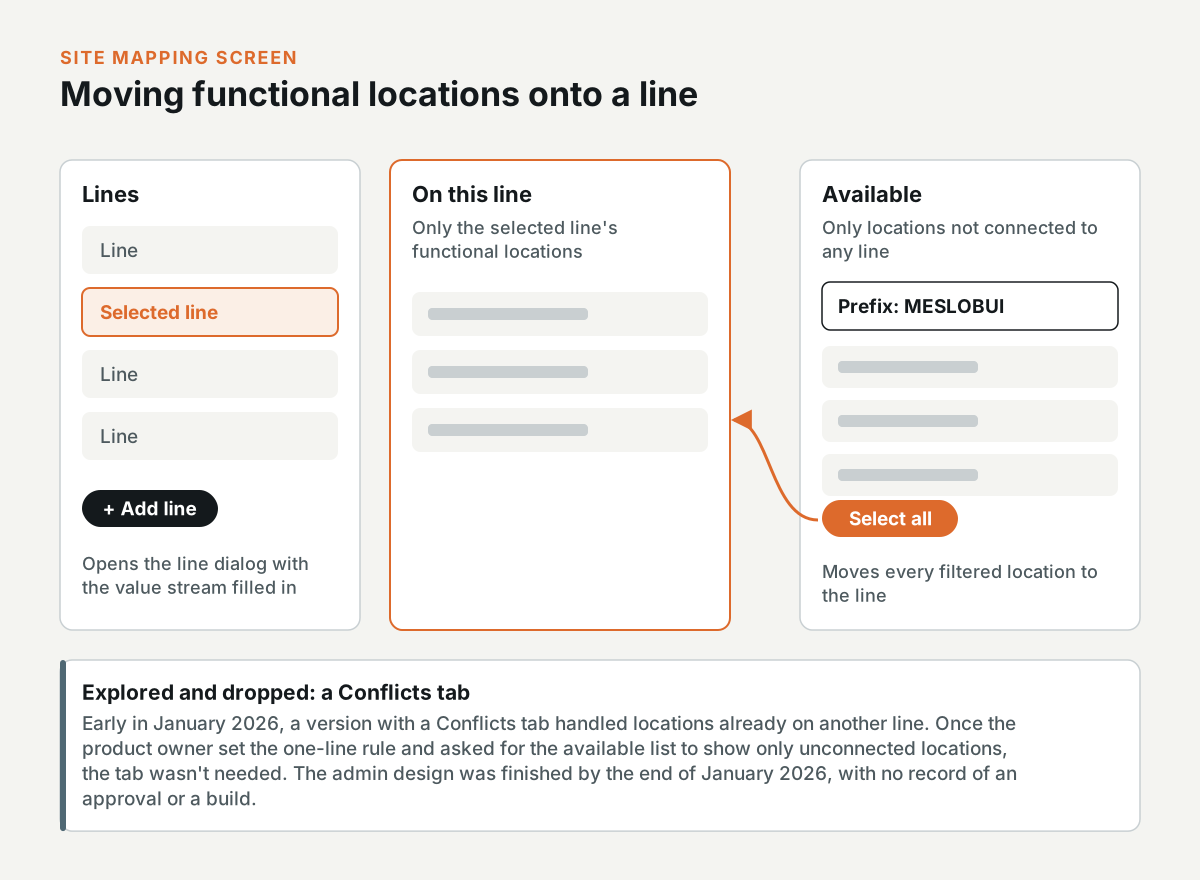
When you click a line, you see only that line's functional locations. Next to them, the available list shows only the locations that aren't connected to any line yet. Above it, there's a prefix filter. An admin types a code like MESLOBUI, the list shows every location under that code, and Select all moves the filtered results to the line in one go. Add line opens the same dialog with the value stream already filled in.
Earlier in January 2026, I had explored a version with a Conflicts tab for locations that were already on another line. Once the product owner set the one-line rule and asked for the available list to show only unconnected locations, that tab wasn't needed anymore, and the design follows his version.
The admin design was finished by the end of January 2026. I don't have a record of an approval or a build for these pages.
Downtime in speed mode
Interactive prototype: Open the prototype. Try this: Add a planned event for the morning shift, then explain the 8 minutes that are still unexplained.
Downtime is the FMOS screen where operators log a shift's planned and unplanned events and explain the production losses. The existing version measured production in tons. Some factories can't forecast in tons, because they measure line speed in cuts per minute, or cpm, so they needed a second mode. The site admin chooses tons or speed for each factory.
The ton-based layout was the other designer's work, and it was already approved and in development. In August 2025, I owned the speed-mode redesign of the main page. I reused the approved layout and designed the main page first. The three existing popups were left for later.
What changed in speed mode
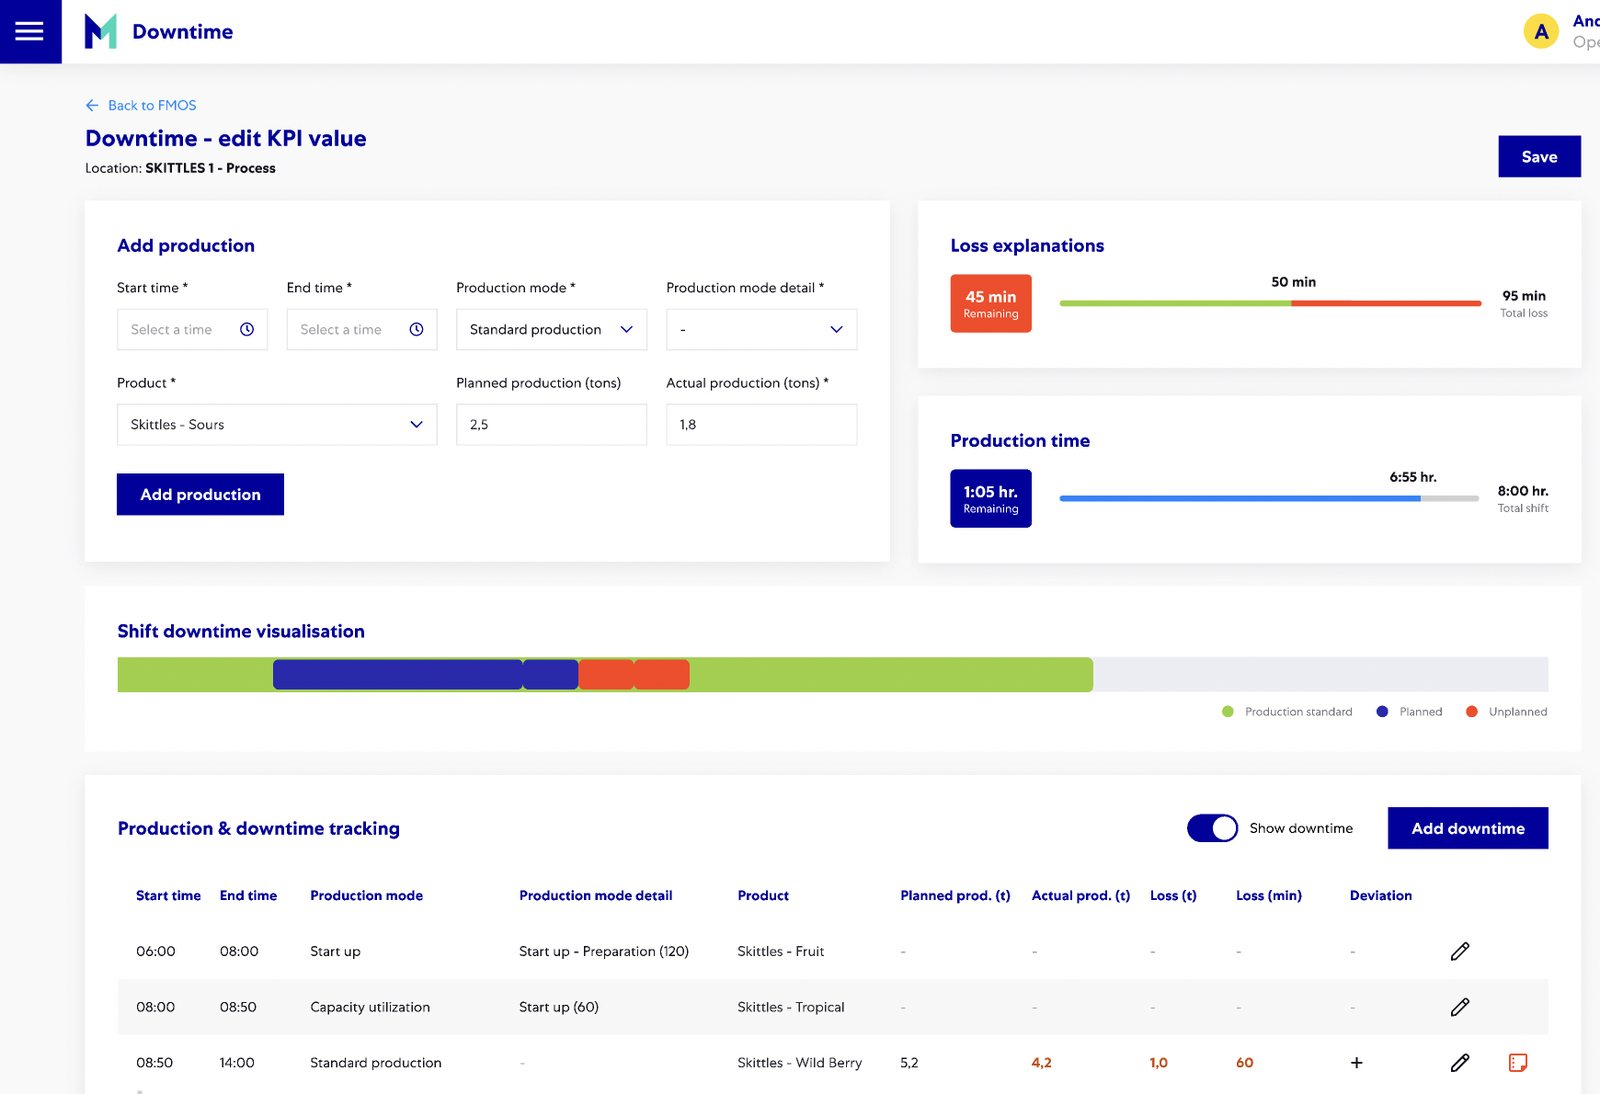
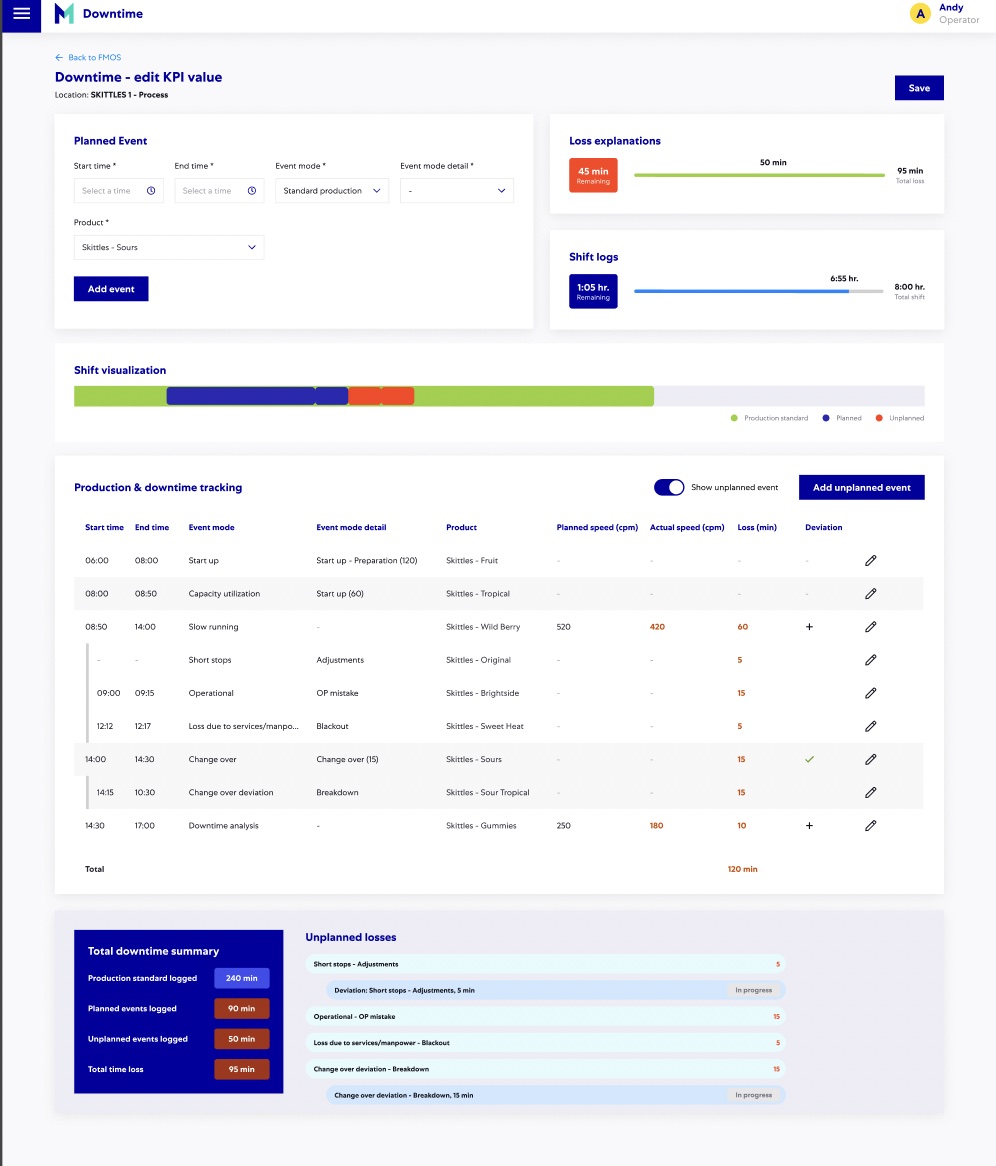
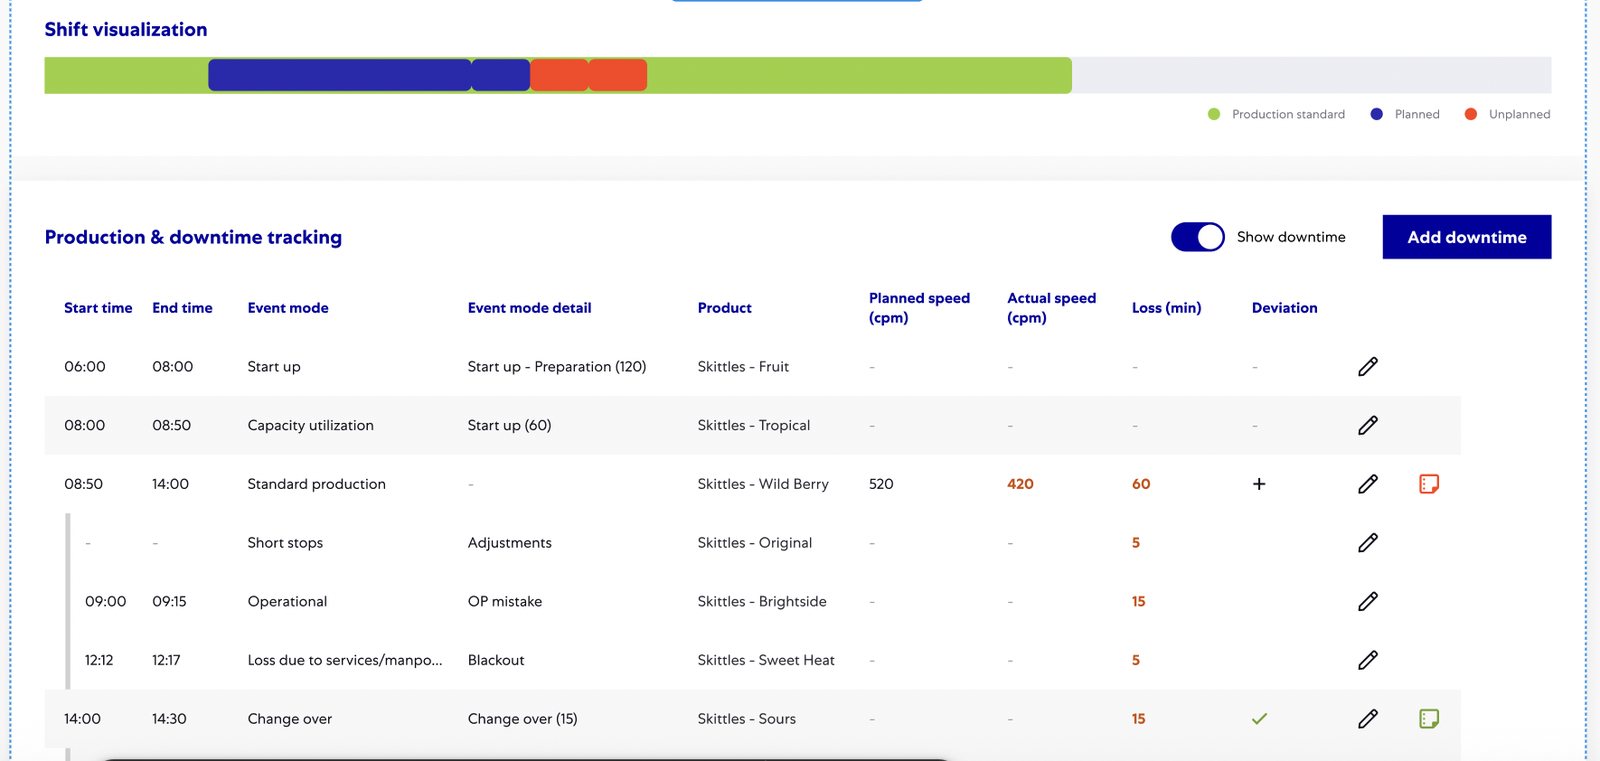
Within Mars, downtime is one specific KPI, while cleaning and maintenance count towards other KPIs. So the labels couldn't keep calling every event production or downtime. Add production became Add event, Production mode became Event mode, and Add downtime became Add unplanned event. Planned and actual production in tons became Planned speed and Actual speed, in cpm.
Production time became Shift logs, with the progress bar for the 8-hour shift. I merged the shift downtime visualisation and the total downtime summary, and each event type has its own colour on the shift bar. The summary shows minutes only, without tons or currency.
In the tracking table, I removed only the Loss (t) column, and Loss (min), Deviation, and the notes stayed. Unplanned events are nested under the planned event they happened in, and each unplanned event has a location field.
Reviews with the FMOS stakeholders
I presented the two modes at the end of August 2025. The stakeholders then defined two subcategory fields for downtime, which the site admin sets up, and asked for the location field on unplanned events. In early September 2025, I designed the error for a shift with no planned event recorded, and worked through unplanned events that cross a shift change.
On 5 September 2025, a stakeholder corrected one rule. I'd changed the hyphen and the zero in every record, and only the planned rows should have changed. For an unplanned event, Loss (min) always equals the duration of the event.
The list of planned and unplanned event categories that the stakeholders sent was example data. I built all of it in as requirements, and that caused rework in September 2025.
I don't have a record of the speed mode being approved or released. In June 2026, the team talked about restarting the Downtime work, and I ran a Downtime design session on 8 June 2026.
FMOS admin and personal pages
Interactive prototype: Open the prototype. Try this: Open KPI target settings, change a target on a unit, and save it. Then set Preview as to Team lead to see what that role can change.
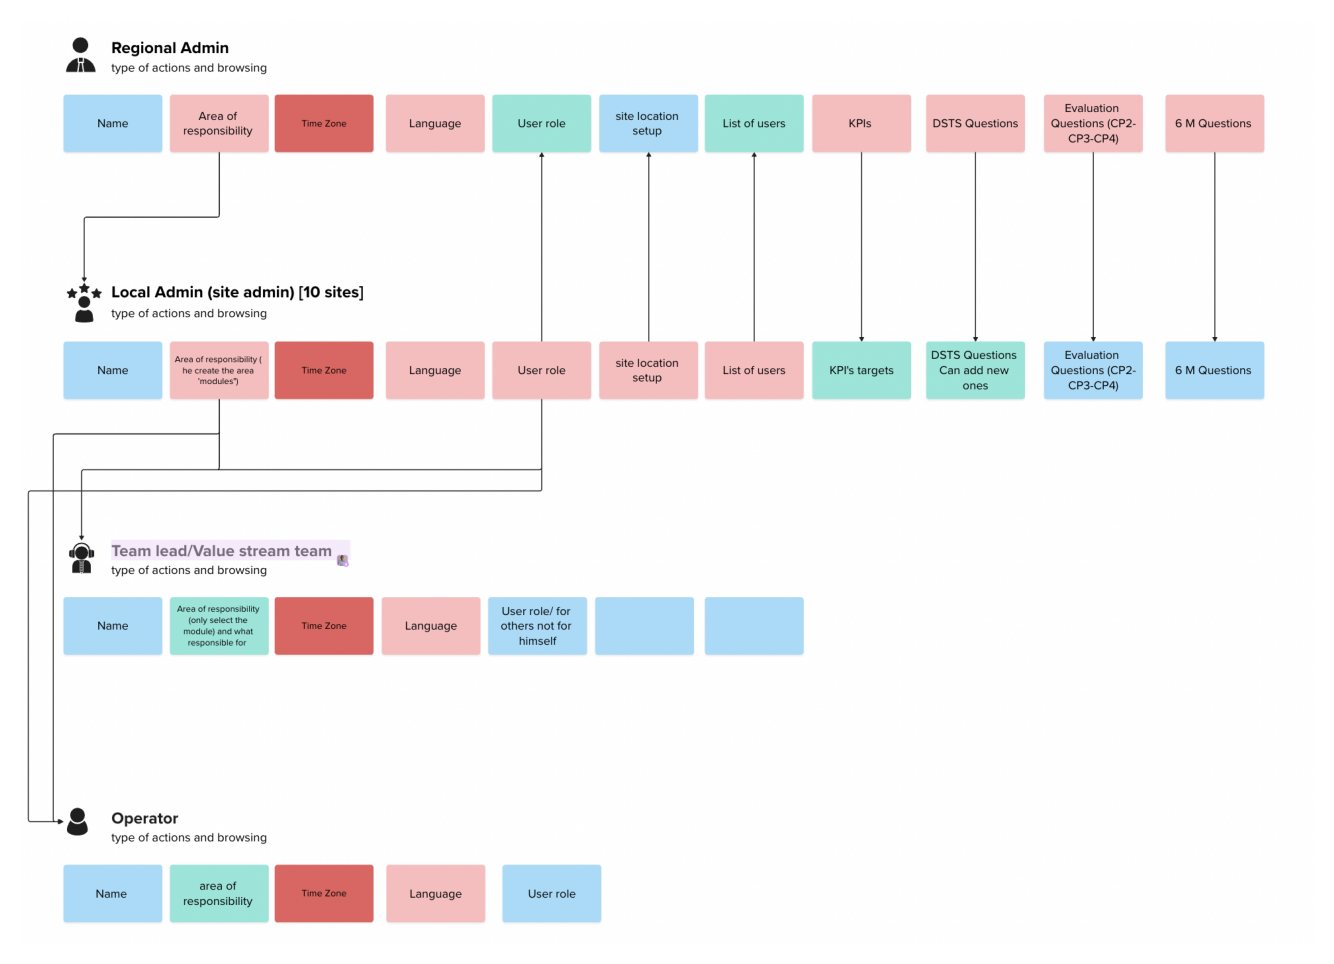
This was my first project, in July 2025. FMOS needed a personal page where each user manages their own profile, and admin pages where the local and regional admins set up their sites. There are four roles: operator, team lead, local admin, and regional admin.
The other designer and the stakeholders had already mapped the roles in Miro, and I led the design of the pages from that map. Every role sets their name, area of responsibility, time zone, and language. Admins also manage the site's locations, the list of users, the KPI targets, and the question sets, like the DSTS questions for the daily safety trigger and the evaluation questions for CP2 to CP4.
A local admin can add or edit KPIs but can't create them. A local admin creates the modules for the site, and a team lead only selects the module they're responsible for. Local admins can also add their own questions to the daily safety trigger.
The colour legend on the Miro map wasn't captured, so the prototype only uses the permissions that are written out on the map.
KPI target settings
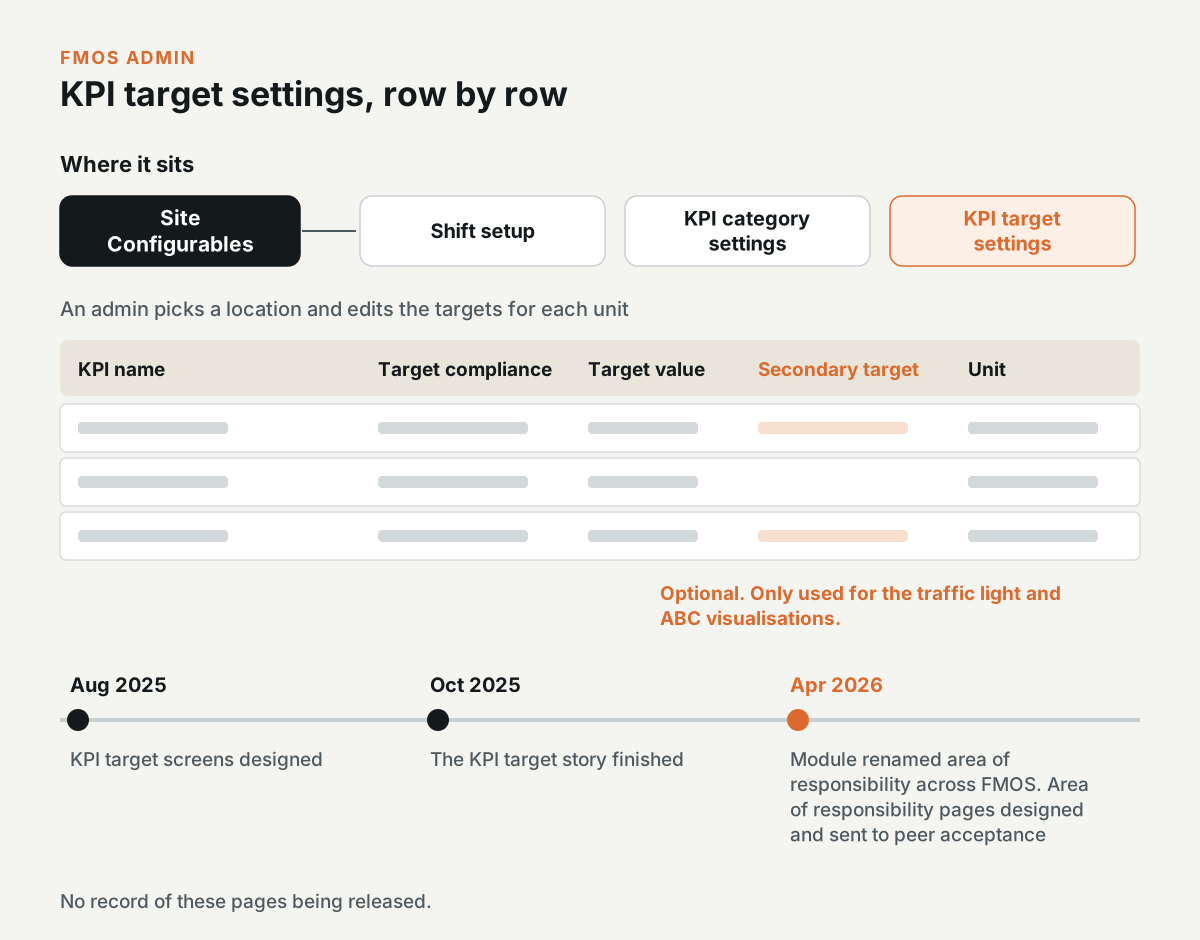
The KPI target settings are under Site Configurables, next to the shift setup and the KPI category settings. An admin picks a location and edits the targets for each unit. Each KPI row has the KPI name, the target compliance, the target value, an optional secondary target, and the unit. The secondary target is only used for the traffic light and ABC visualisations.
I designed the KPI target screens in August 2025 and finished that story in October 2025. In April 2026, the team replaced the word module with area of responsibility across FMOS, and I designed the area of responsibility pages, which went into peer acceptance that month.
I don't have a record of these pages being released.
CP meetings, Game Plan, and the shiftboard
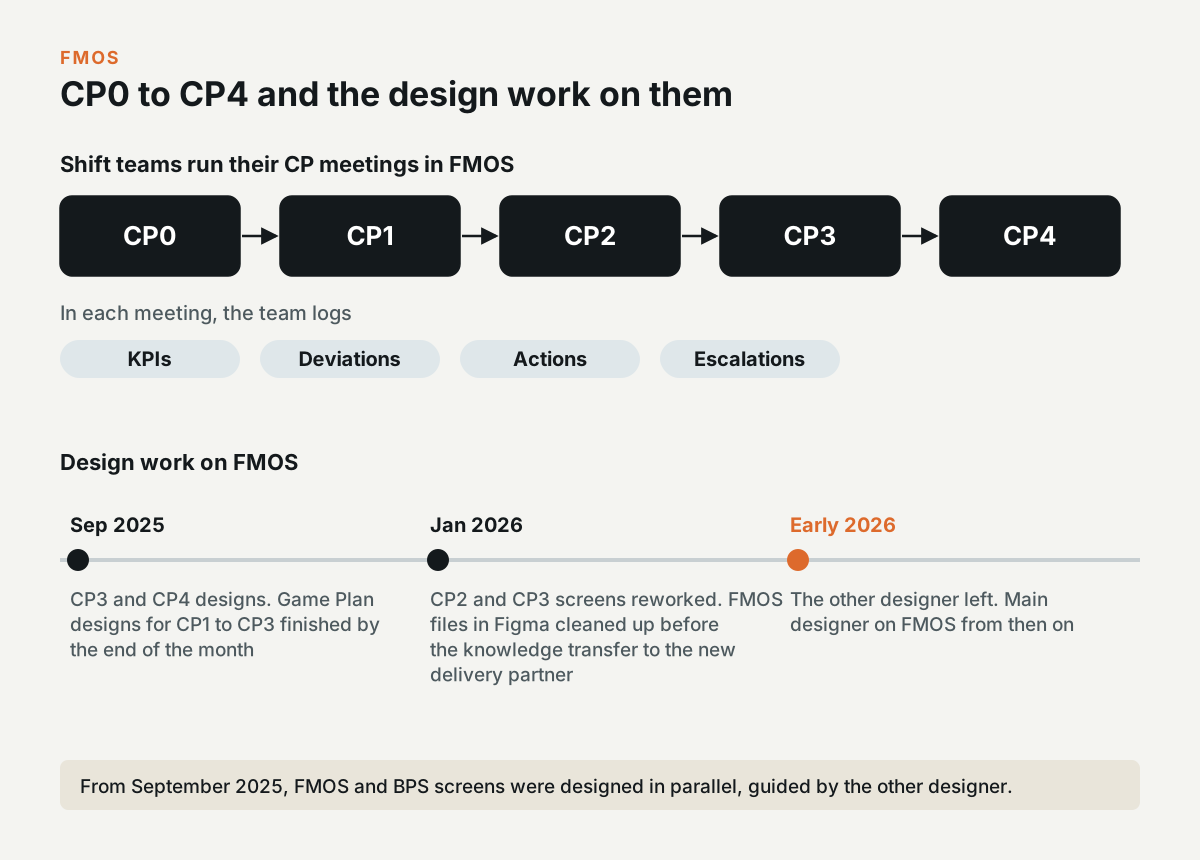
FMOS is where shift teams run their CP meetings, from CP0 to CP4, and log their KPIs, deviations, actions, and escalations. From September 2025, I designed FMOS and BPS screens in parallel, with the other designer guiding me. After the other designer left in early 2026, I was the main designer on FMOS.
In September 2025, I worked on the CP3 and CP4 designs, and the Game Plan designs for CP1 to CP3 were finished by the end of that month. In January 2026, I reworked the CP2 and CP3 screens and cleaned up the FMOS files in Figma before the knowledge transfer to the new delivery partner.
This tab doesn't have a prototype. I only have the meeting notes for this work, and not the screens.
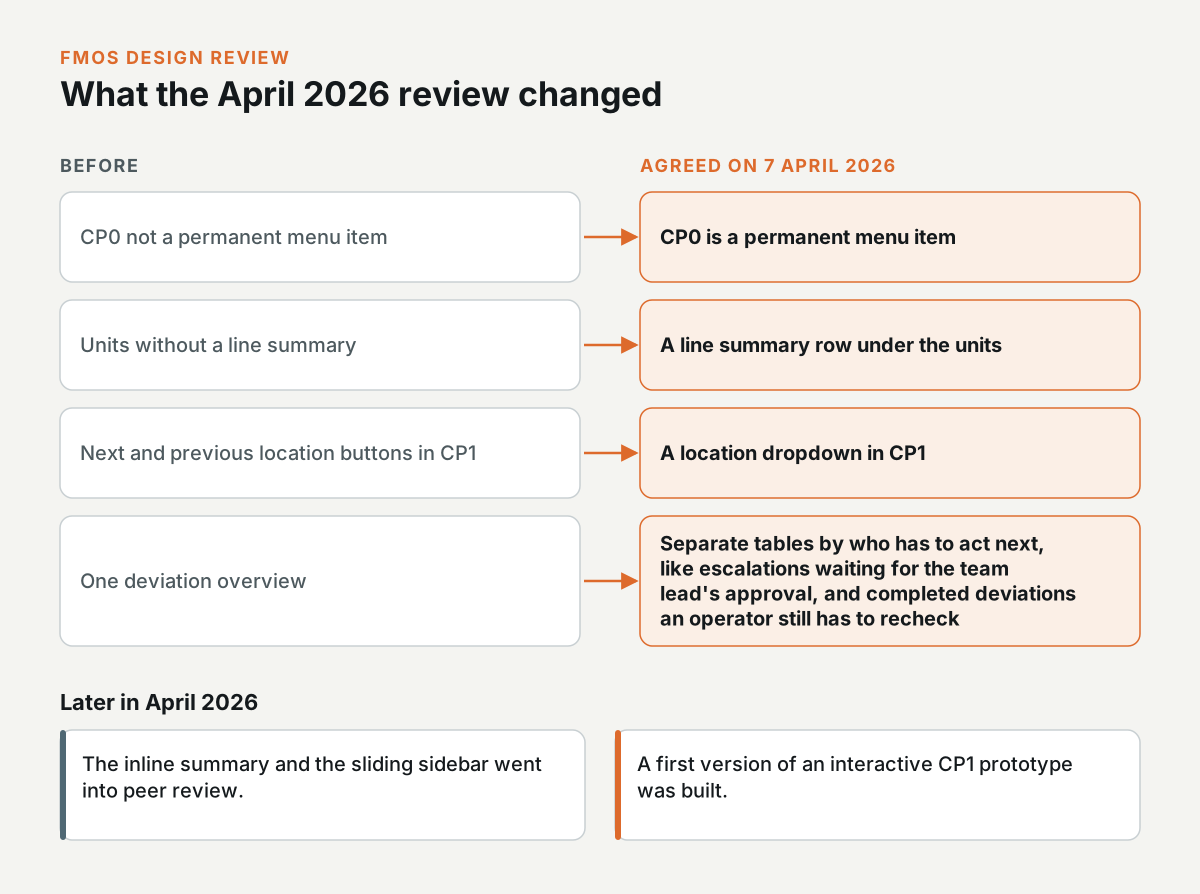
Changes from the April 2026 design review
At the design review on 7 April 2026, the team agreed to make CP0 a permanent menu item and to add a line summary row under the units. The next and previous location buttons in CP1 became a dropdown. The deviation overview was split into separate tables by who has to act next, like the escalations that wait for the team lead's approval, and the completed deviations that an operator still has to recheck.
Later that month, the inline summary and the sliding sidebar went into peer review, and I built the first version of an interactive CP1 prototype.
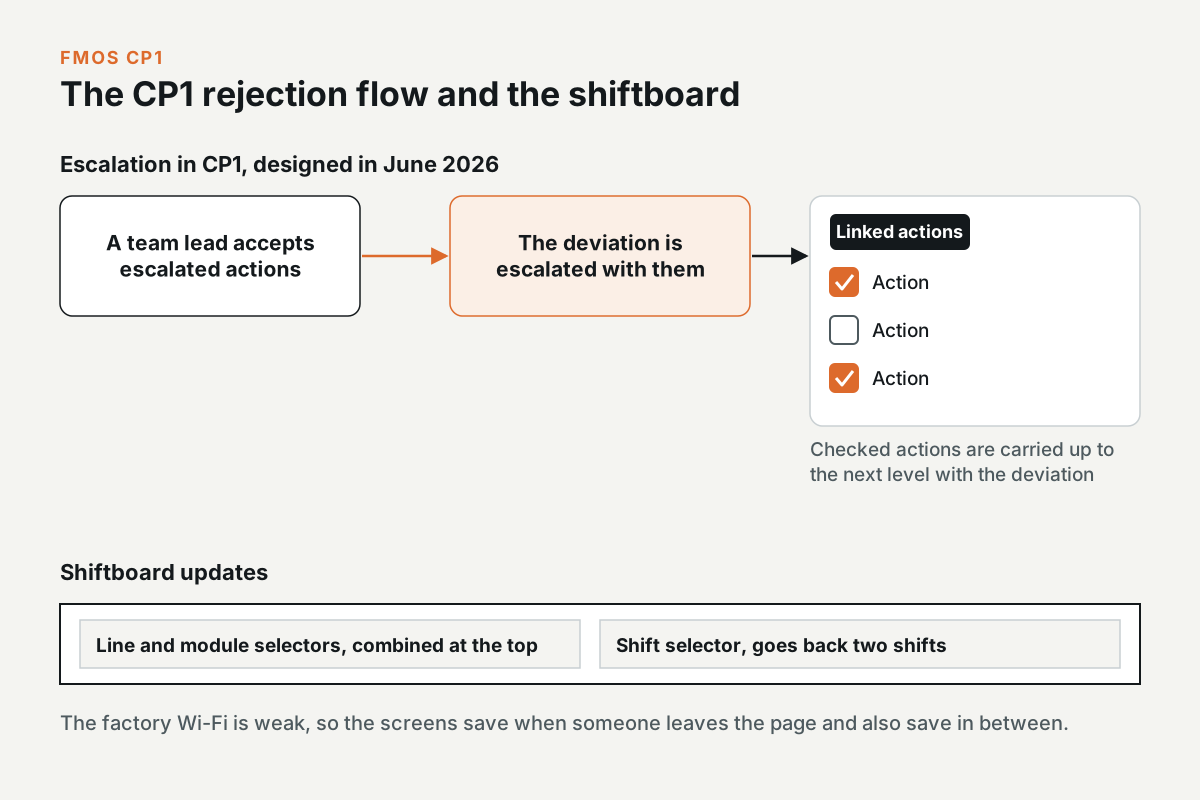
The CP1 rejection flow and the shiftboard
In June 2026, I designed the CP1 rejection flow and the shiftboard updates. When a team lead accepts escalated actions, the deviation is escalated with them. The linked actions are in a tab on the deviation, with checkboxes for carrying the selected ones up to the next level.
The Wi-Fi in the factories is weak, so the screens save when you leave the page and also save in between. The line and module selectors were combined at the top, and the shift selector goes back two shifts.
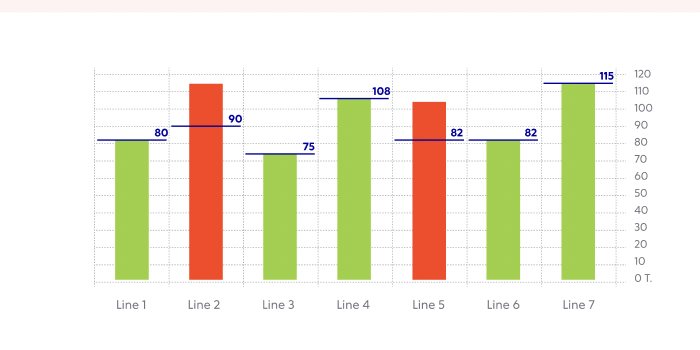
Labels on the CP graphs
In August 2025, I did a small exploration for the CP bar charts. The KPI and line names are standardised and long, and teams can't rename them, so the axis labels were hard to read. I proposed short codes on the axis, with the full names in a searchable legend under the chart, and a second version with the full name on hover. I sent both designs, and the team didn't pick one while I was there.
BPS escalations
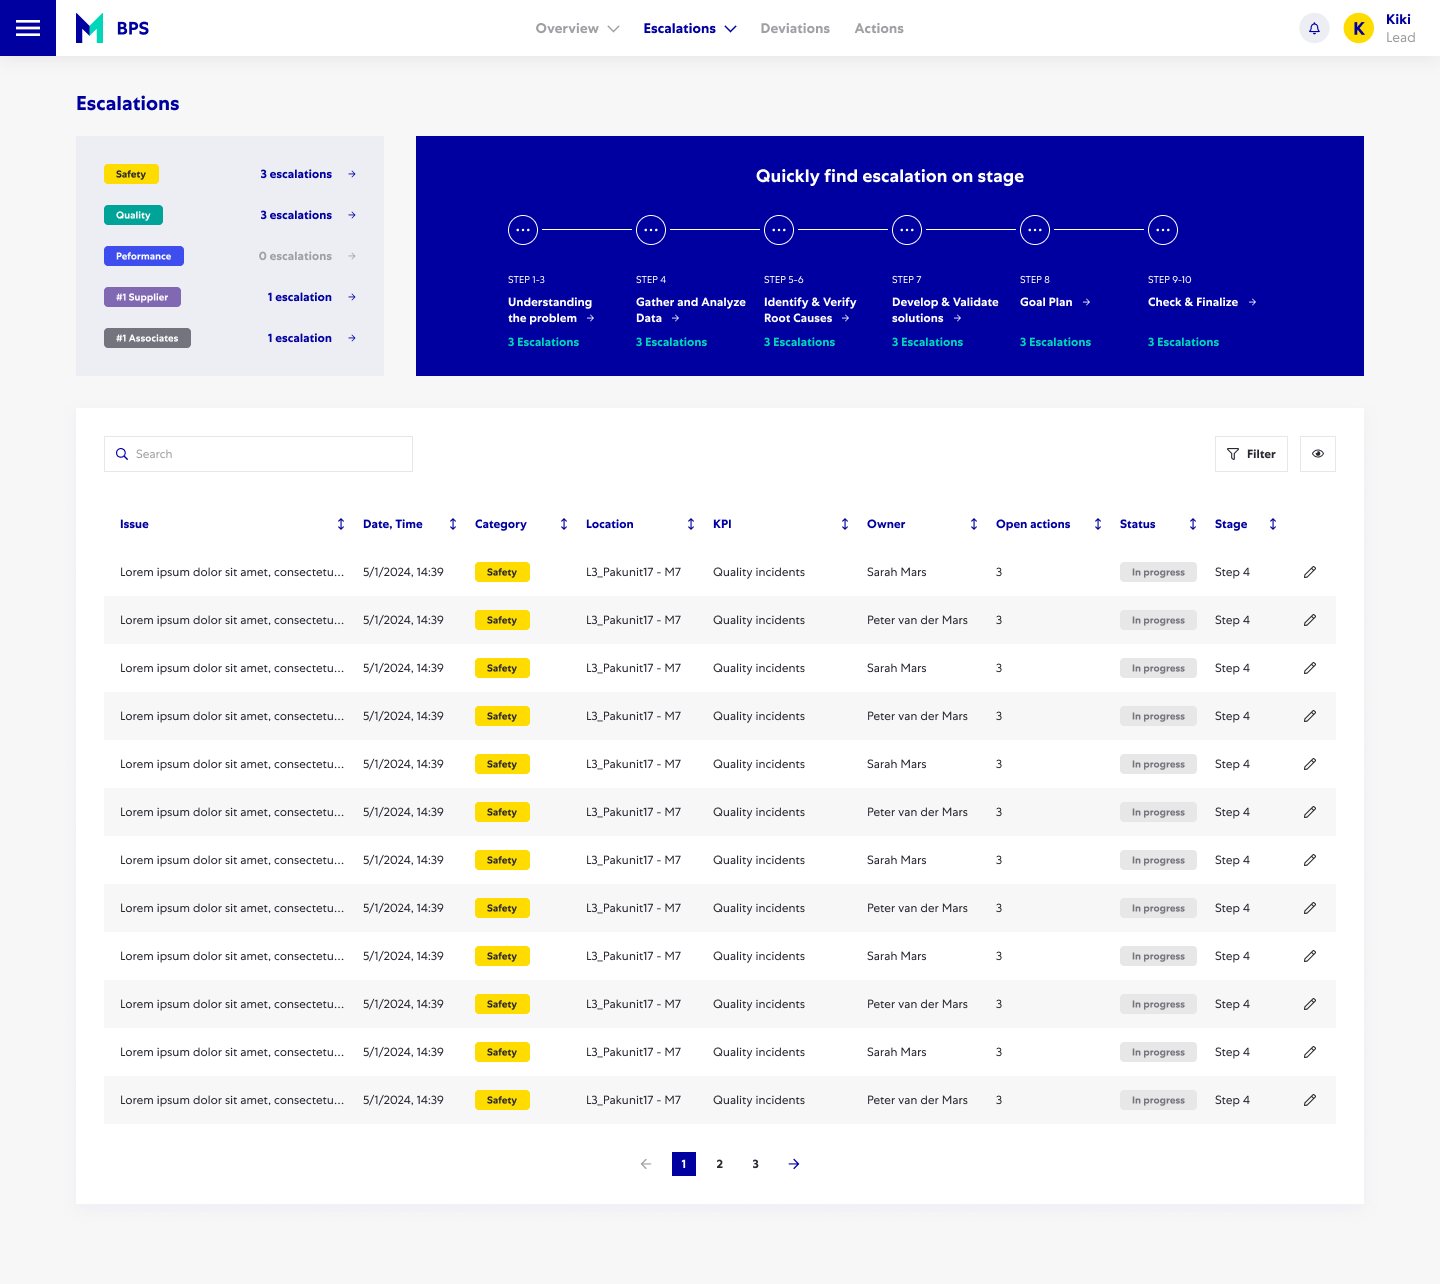
BPS, Basic Problem Solving, is the Mars tool for process and people-related deviations. A KPI deviation gets actions, and if the team can't solve it at their level, it's escalated up the CP levels through a ten-step method. Technical breakdowns go to Breakdown Analysis instead.
The detailed BPS screens came from a previous agency, and their components were locked in that agency's Figma files. I supported the BPS work. In October 2025, I went through the existing screens to learn the flows, because the new Breakdown Analysis was going to be built next to BPS and share its components.
This tab doesn't have a prototype, because the detailed screens aren't my work.
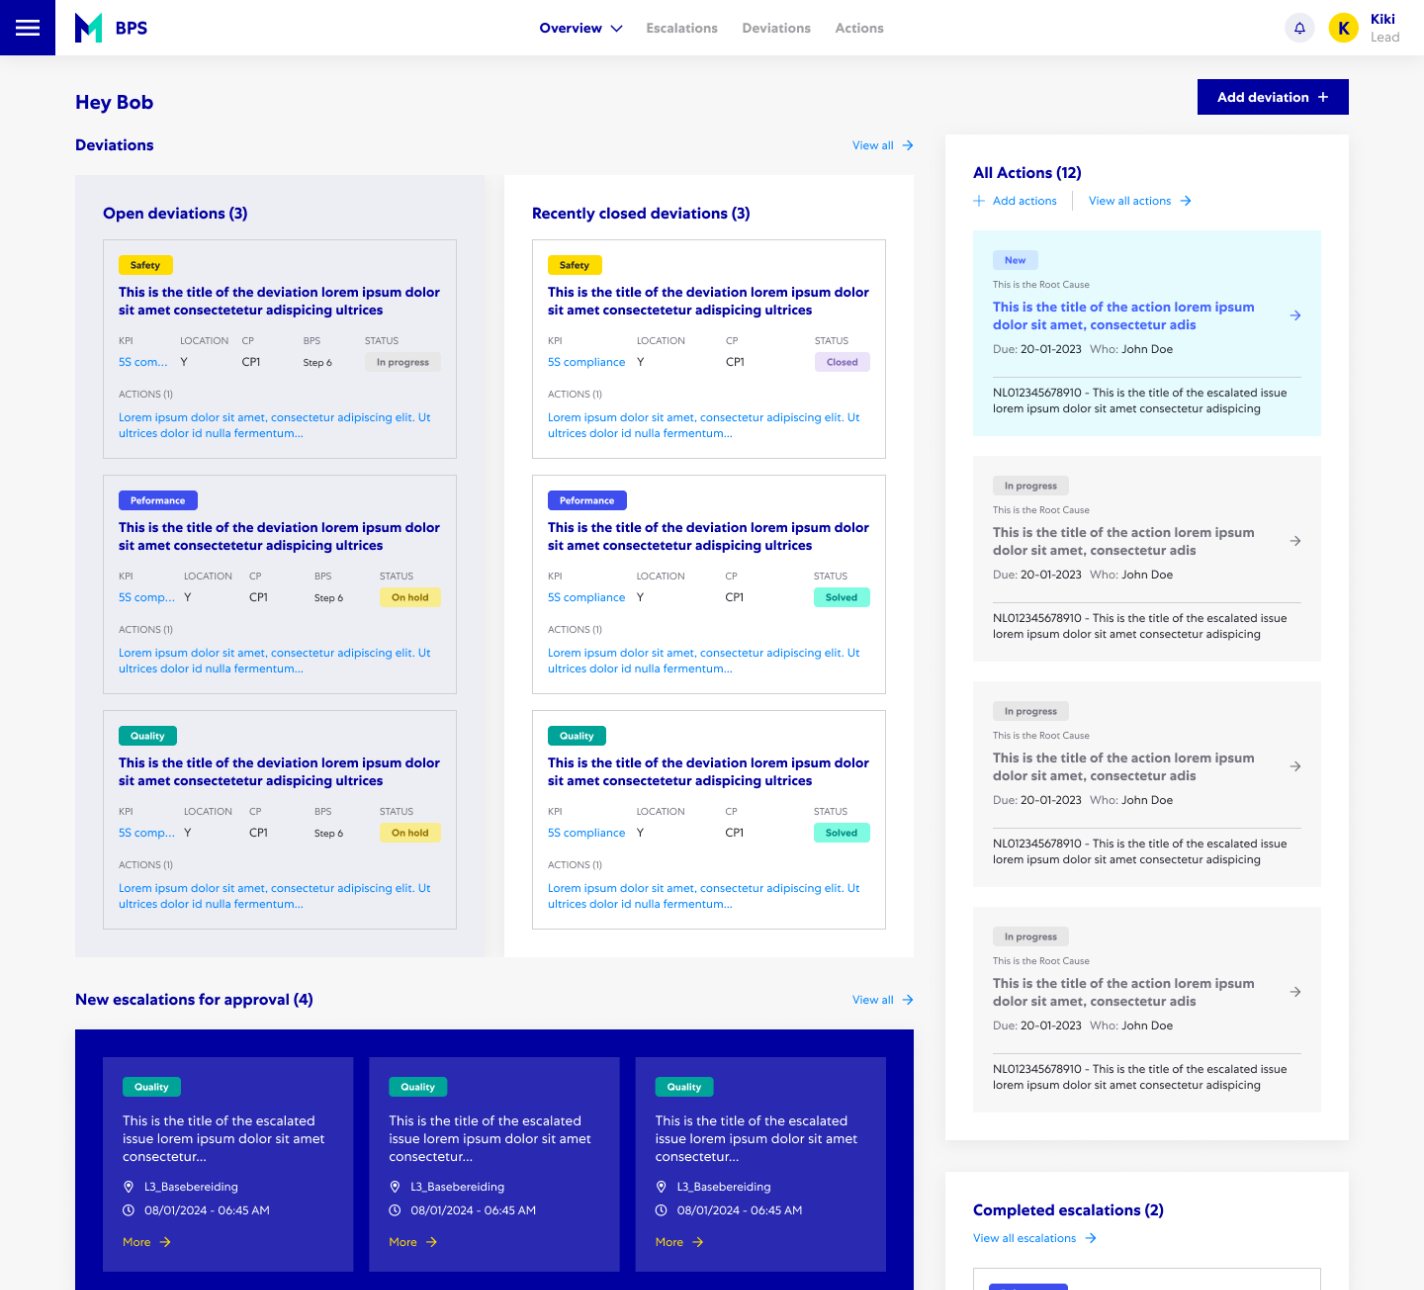
The escalation overview redesign
My own BPS design was the escalation overview, in September 2025. The page split the actions into my actions and all actions, and that didn't match how the live implementation worked. I changed it to ongoing and completed, with a toggle to switch between all actions and only your own.
In November 2025, I aligned the Breakdown Analysis and BPS components. The add-action card in Breakdown Analysis took the BPS style with a plus button, and BPS was set to adopt the confirmation actions from Breakdown Analysis.
The design system in Figma and Mendix
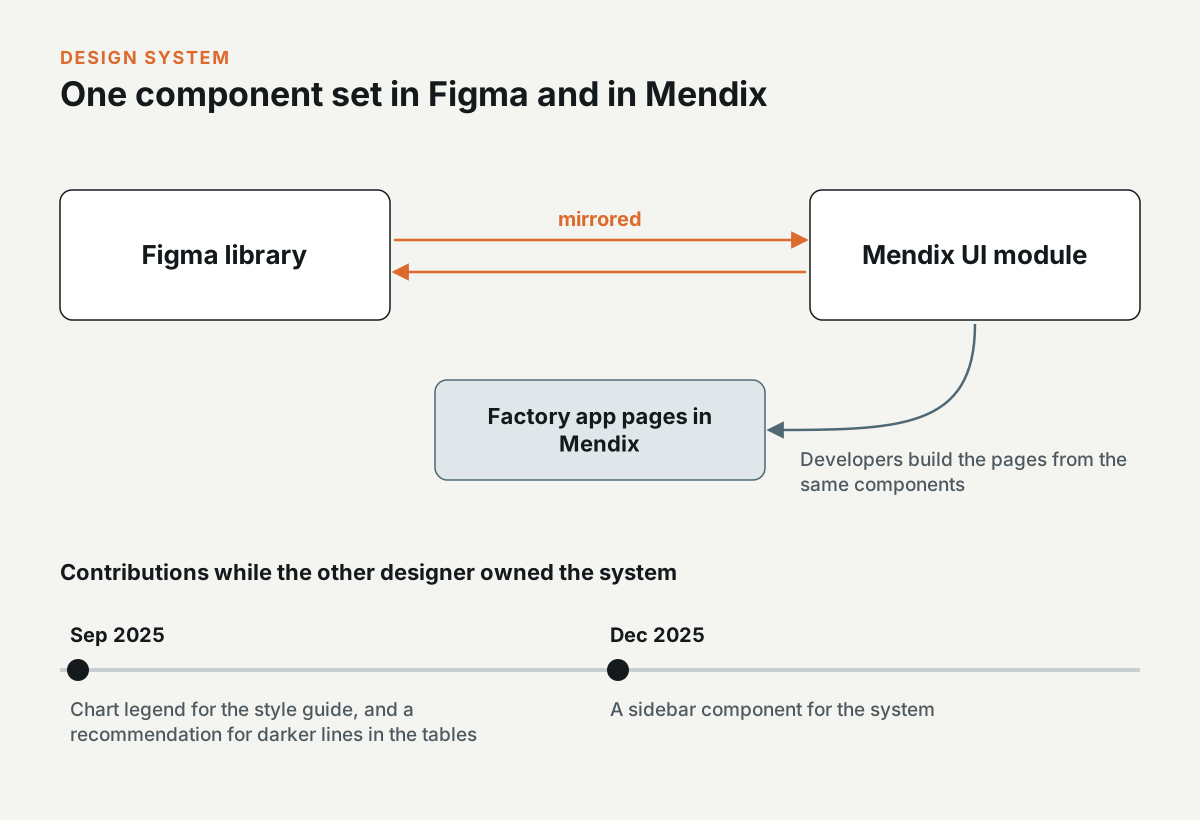
Mars builds its factory apps in Mendix. The design system is a Figma library mirrored by a Mendix UI module, and developers build the pages from the same components. When I joined, the other designer owned the design system, and I supported it.
In September 2025, I designed the chart legend for the style guide and recommended darker lines in the tables. In December 2025, I designed a sidebar component for the system.
This tab doesn't have a prototype, because the work was about process and structure.
What was wrong with the libraries
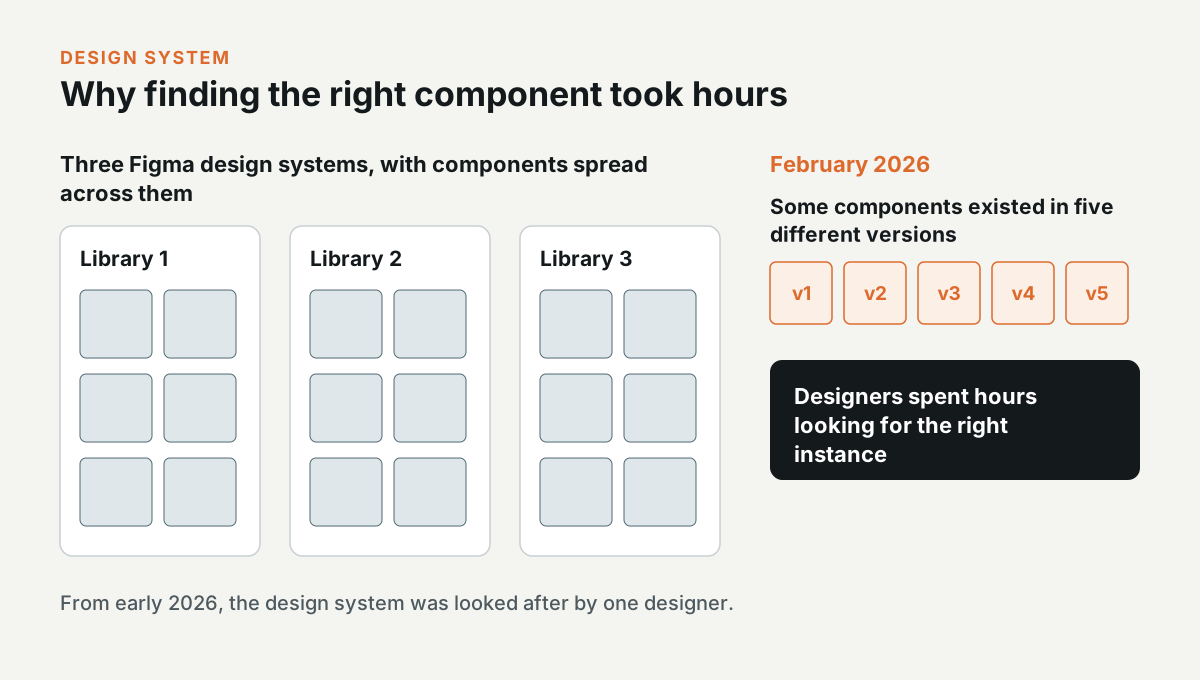
From early 2026, I looked after the design system on my own. By then, Mars had three Figma design systems, and the components were spread across them. In February 2026, some components existed in five different versions, and designers spent hours looking for the right instance.
The governance proposal
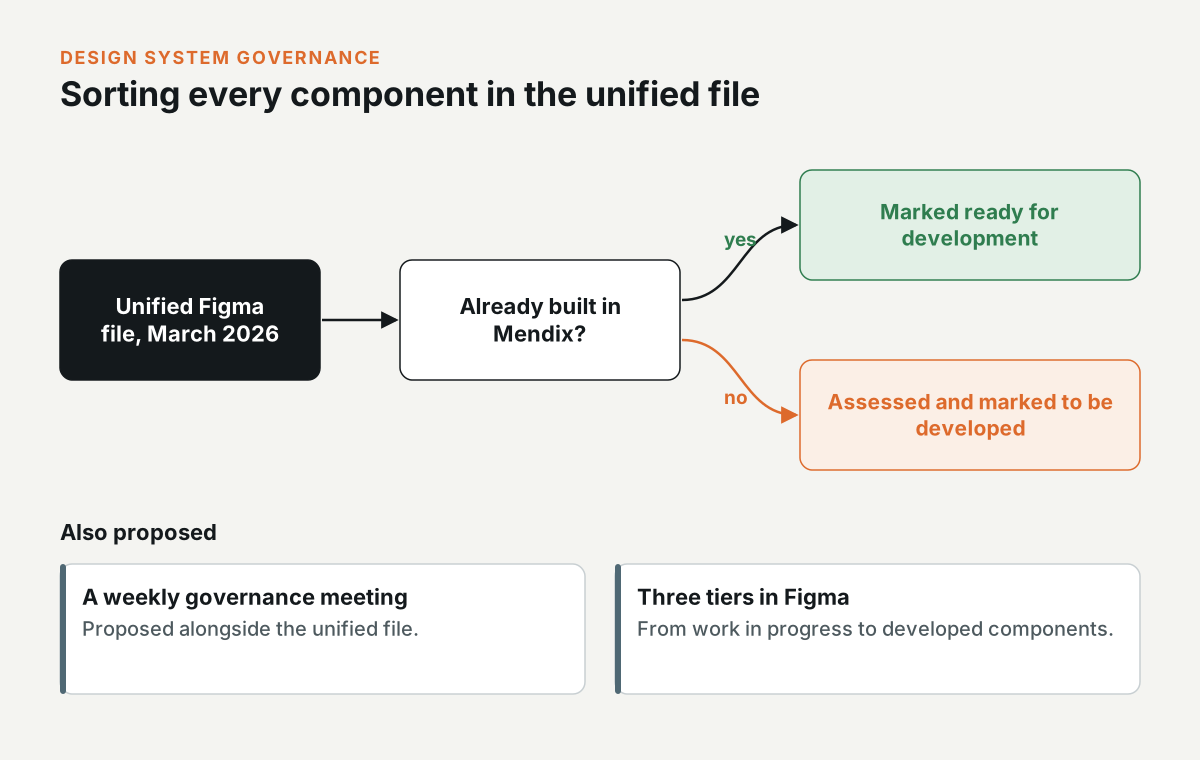
In March 2026, I set up a unified Figma file and moved the components into it. I proposed going through every component and marking the ones already built in Mendix as ready for development. The rest would be assessed and marked to be developed. I also proposed a weekly governance meeting and a three-tier structure in Figma, from work in progress to developed components.
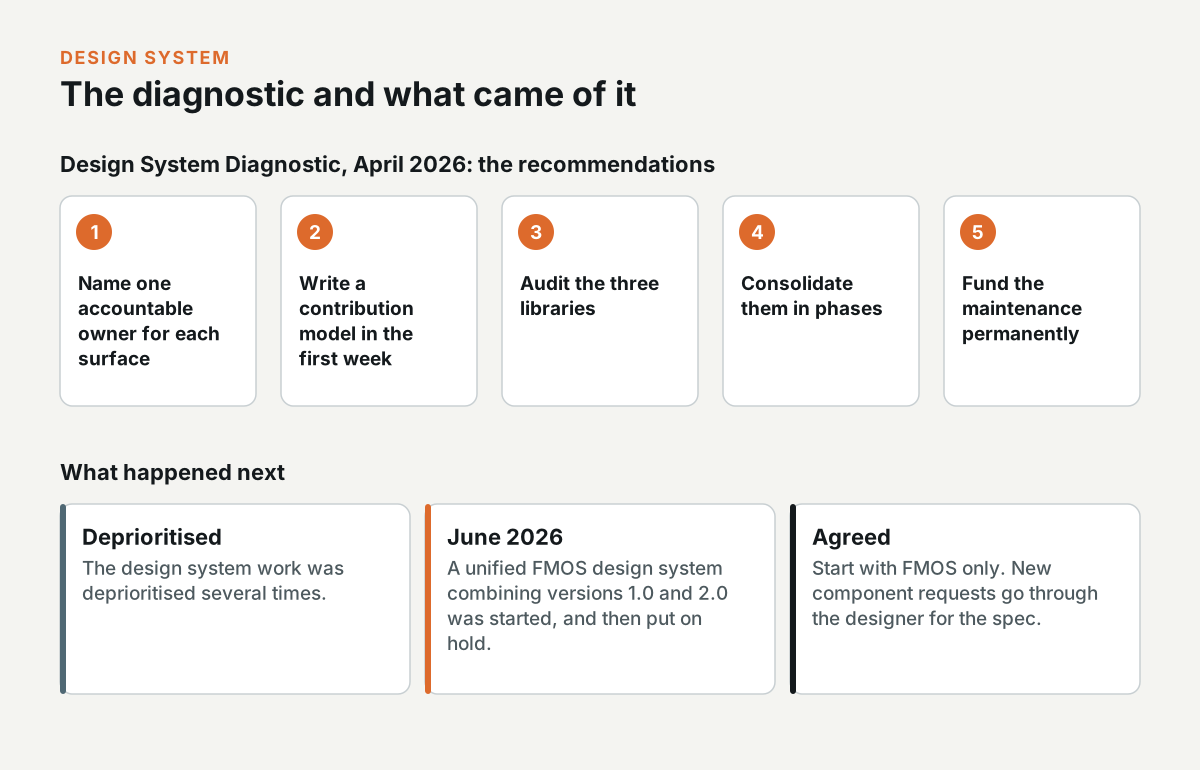
In April 2026, I wrote a Design System Diagnostic for the team. In it, I recommended naming one accountable owner for each surface and writing a contribution model in the first week, then auditing the three libraries, consolidating them in phases, and funding the maintenance permanently.
The design system work was deprioritised several times. In June 2026, I started a unified FMOS design system that combined versions 1.0 and 2.0, and it was put on hold. The team agreed to start with FMOS only, and that new component requests would go through me for the spec.
Need this level of detail in your product?
Work through the hard product decisions early.
If you’re a product team, that can mean a focused design, system, or prototype project. If you’re hiring, it’s a chance to look closer at how I work across research, interfaces, and code.