Bayer · Health
Bayer: ICU Angel, Estimated to Save Up to 2 Million Lives a Year, and Four More Projects
Designed ICU Angel trial screening, wrote the FemHub design scope and ran its usability test, and co-authored the navigation concept tests for the healthcare professional portal.
- Role
- Senior Product Designer
- Scope
- ICU Angel, FemHub, and HCP portal navigation
- Focus
- Health
- Designer
 Gideon Awolesi
My contribution · Bayer
ICU Angel, FemHub, and HCP portal navigation
In the team's own estimate from the prototype reviews, clinicians went from about 30 seconds to less than 5 seconds to spot a critical change.
- 2M
- lives a year, the platform's estimate
- 10
- FemHub test participants
- 3
- navigation concepts tested
What I owned
- 01Designed the ICU Angel pre-screening queues, the patient Development timeline, and the steps from consents to randomization.
- 02Wrote the FemHub design scope, ran the first usability test with 10 participants, and designed the fixes for booking a screening.
- 03Co-authored the moderated test of three navigation concepts for the healthcare professional portal, and built the test prototype with a colleague.
Clickable prototypes
Open the Bayer prototypes
Each project has its own interactive piece. Screen ICU patients for a trial, book a screening in FemHub, compare the navigation concepts, explore the CKD journey map, or prepare a UX test of an AI assistant.
Overview
About the project
Project overview
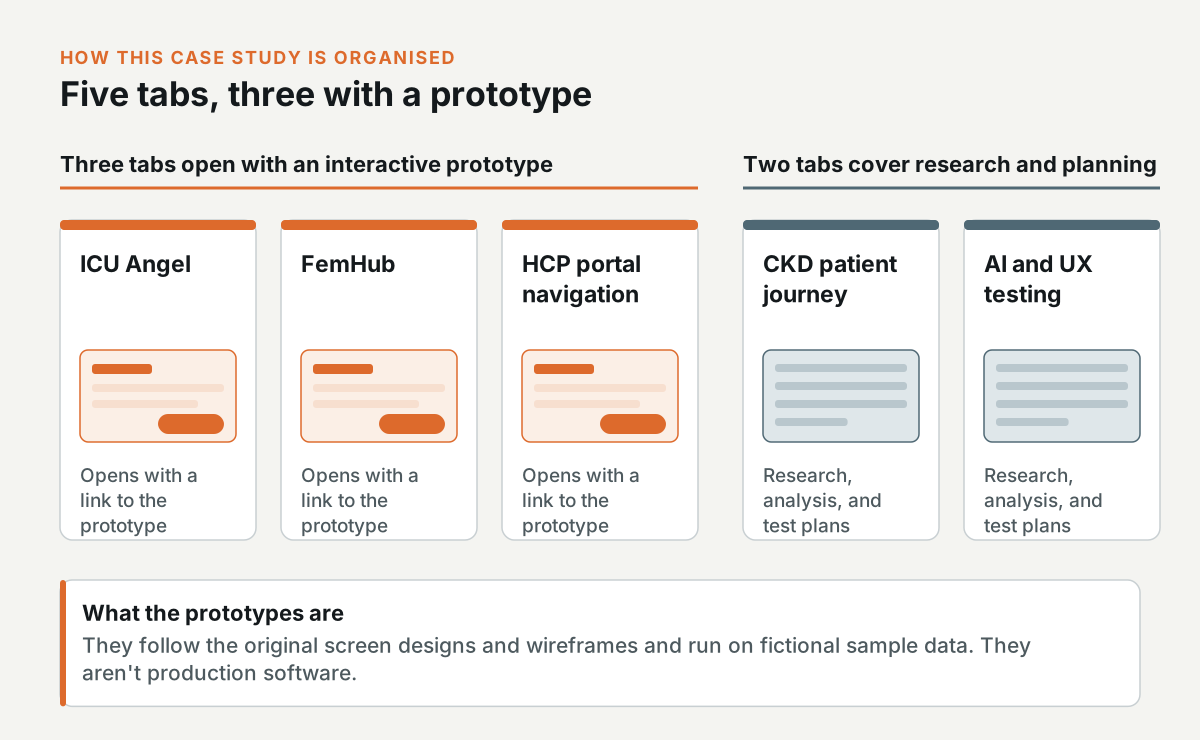
- What I worked on: I worked on five separate projects at Bayer, and each one has its own tab below. The largest was ICU Angel, a digital platform for acute respiratory distress syndrome (ARDS) in intensive care, where I designed the Eligibility Checker and ran the research with ICU staff. I also designed and tested FemHub, a women's health app, and helped run a usability test of three navigation concepts for Bayer's portal for healthcare professionals. The last two tabs cover a patient journey for chronic kidney disease and my work on AI and UX testing.
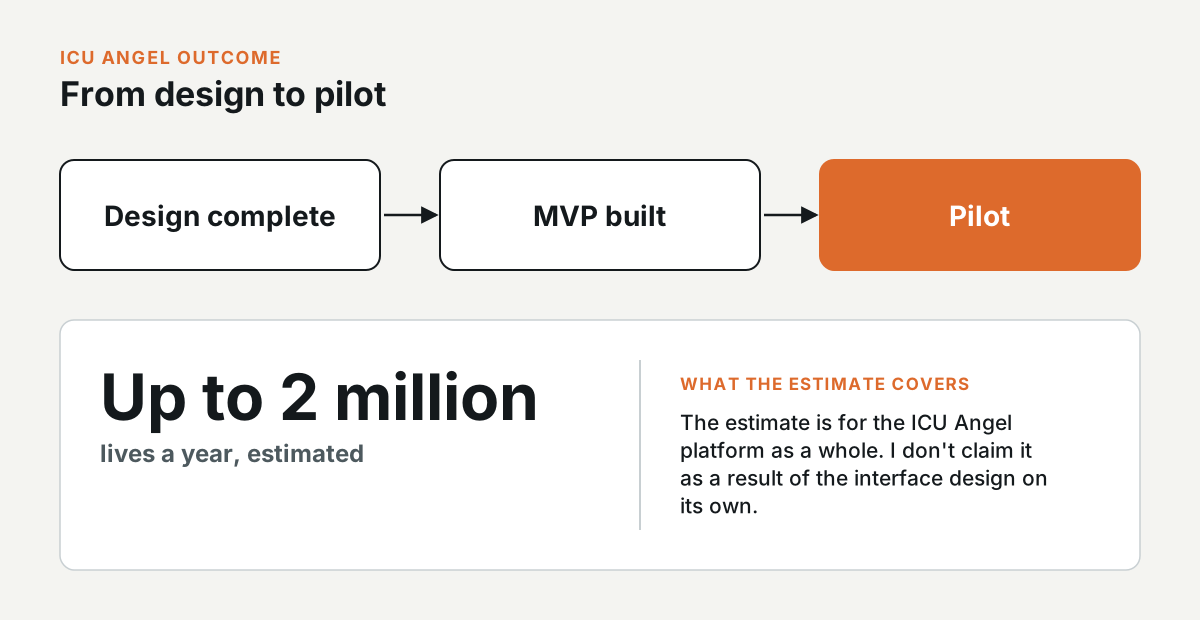
- Outcome: Once the design was complete and the MVP was built, ICU Angel went into a pilot. None of the other four projects has a recorded launch, so each of those tabs ends with what was planned next.
About the tabs and the prototypes
Each tab with an interactive prototype opens with a link to it. The prototypes follow the original screen designs and wireframes, and they run on fictional sample data. They aren't Bayer's production software.
The CKD patient journey and the AI and UX testing tabs cover research, analysis, and test planning, so they don't have a prototype.
ICU Angel and the Eligibility Checker
Interactive prototype: Open the prototype. Try this: Open the patient with the red alert banner and press Request diagnosis, then Request authorization. After that, go to Screening and take the patient through the four steps to Start Randomization.
Bayer built ICU Angel as a digital platform for ARDS in intensive care, alongside a new ARDS medication. ARDS can develop in a patient who's already in the ICU for something else, such as sepsis or pneumonia, and the ICU team has to notice it early enough to enrol the patient in a clinical trial.
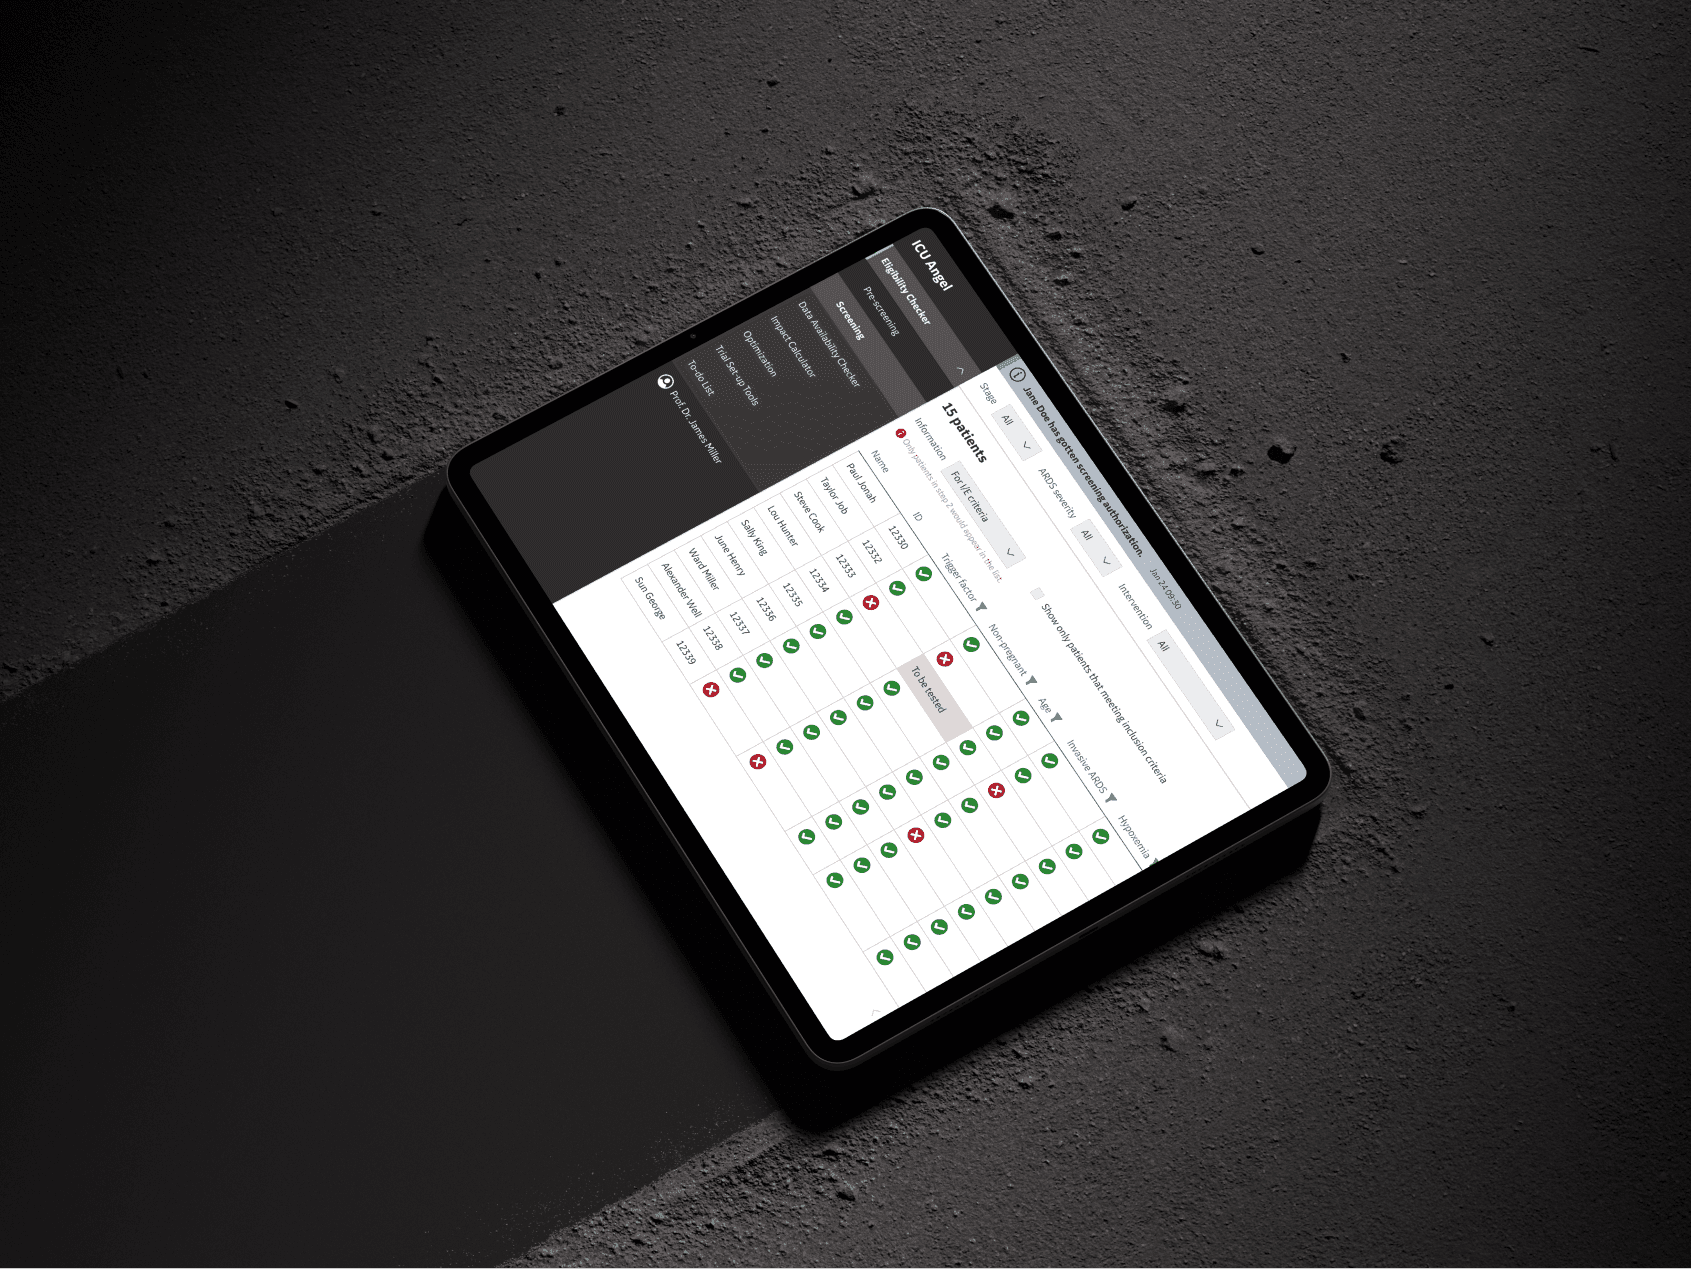
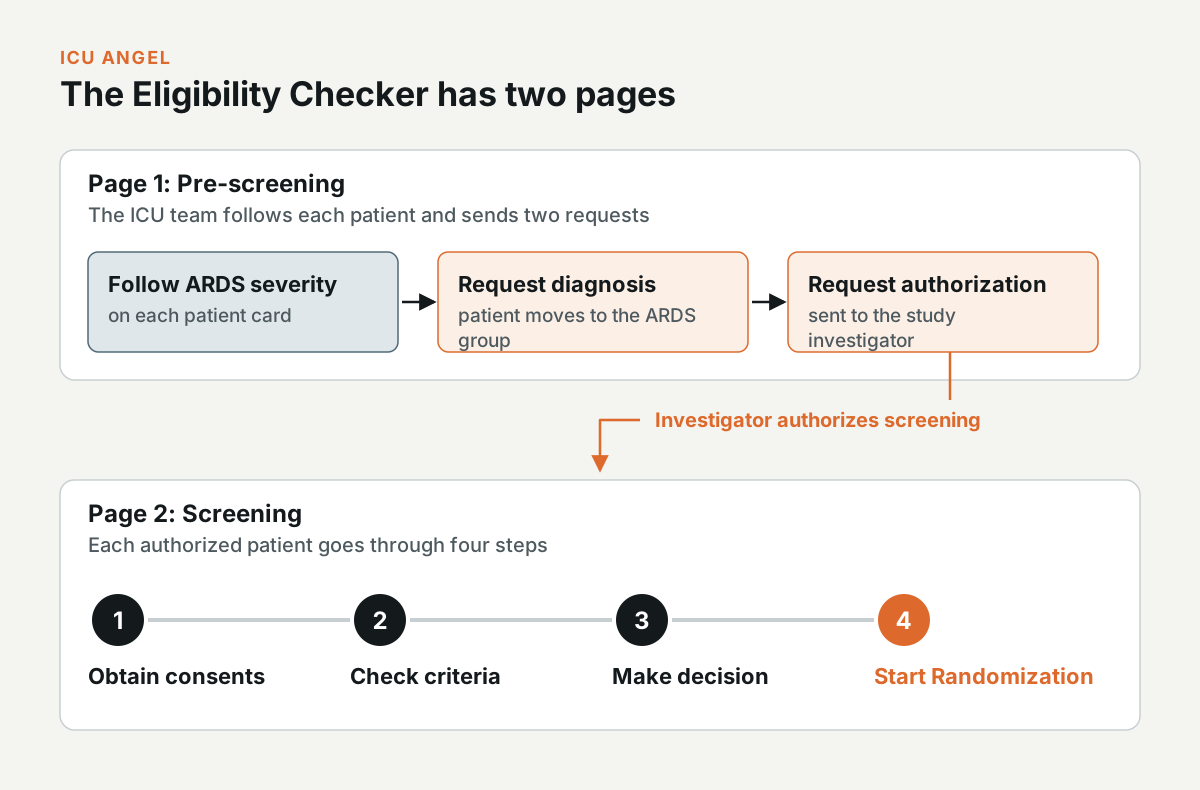
I designed the Eligibility Checker, the ICU Angel module for finding patients who are developing ARDS and recruiting them into an ARDS clinical trial. It has two pages. On Pre-screening, the ICU team follows each patient's ARDS severity and sends the requests for the diagnosis and for authorization from the study investigator. On Screening, the team checks each authorized patient against the trial's inclusion and exclusion criteria and takes them through the steps to randomisation.
How ICU Angel organises critical care data
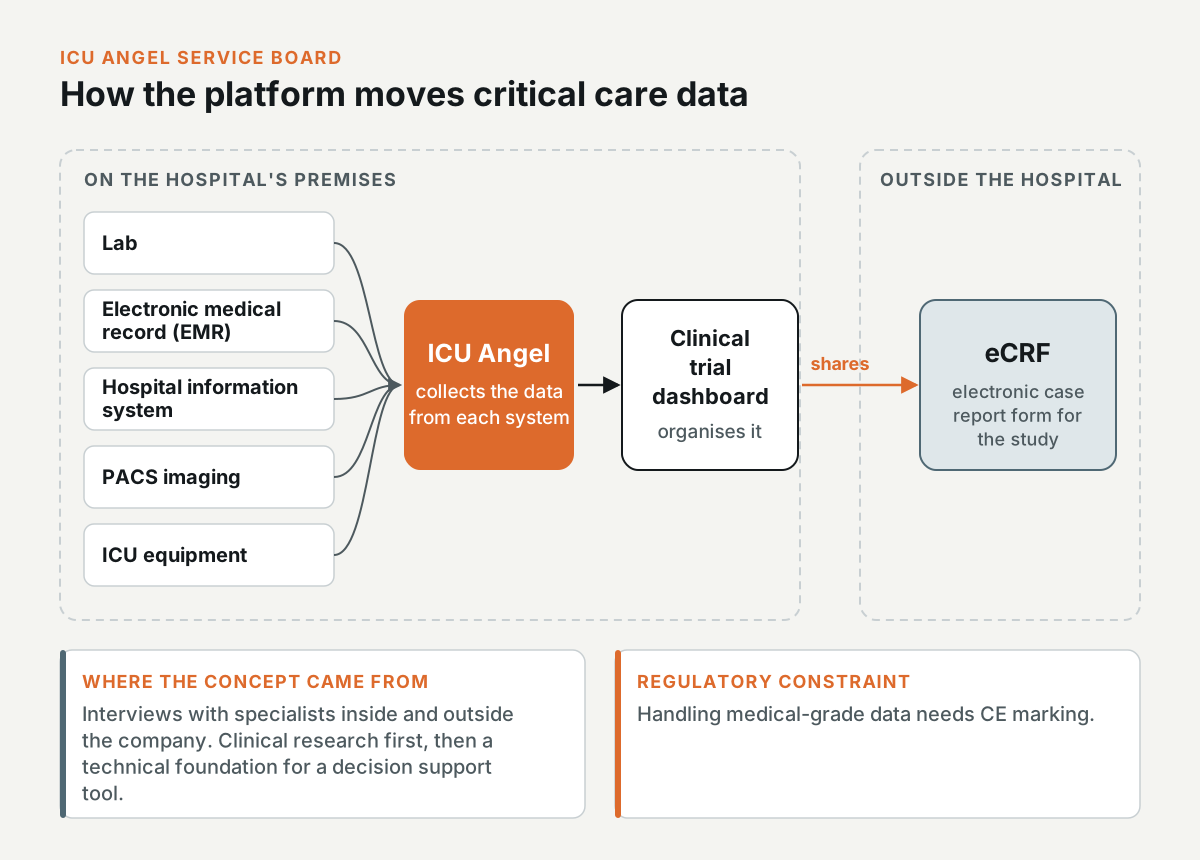
In a critical care unit, the data for a clinical study is spread over a lot of hospital systems. On the ICU Angel service board, the platform collects data from the systems on the hospital's premises: the lab, the electronic medical record (EMR), the hospital information system, PACS imaging, and the ICU equipment. It organises that data in a clinical trial dashboard and shares it with the electronic case report form (eCRF) that the study uses outside the hospital.
The concept came from interviews with specialists inside and outside Bayer. It was meant to support clinical research first, and to be the technical foundation for a decision support tool later on. Handling medical-grade data needs CE marking, and the board lists that as a regulatory constraint on the platform.
The suite of services and the user for each one
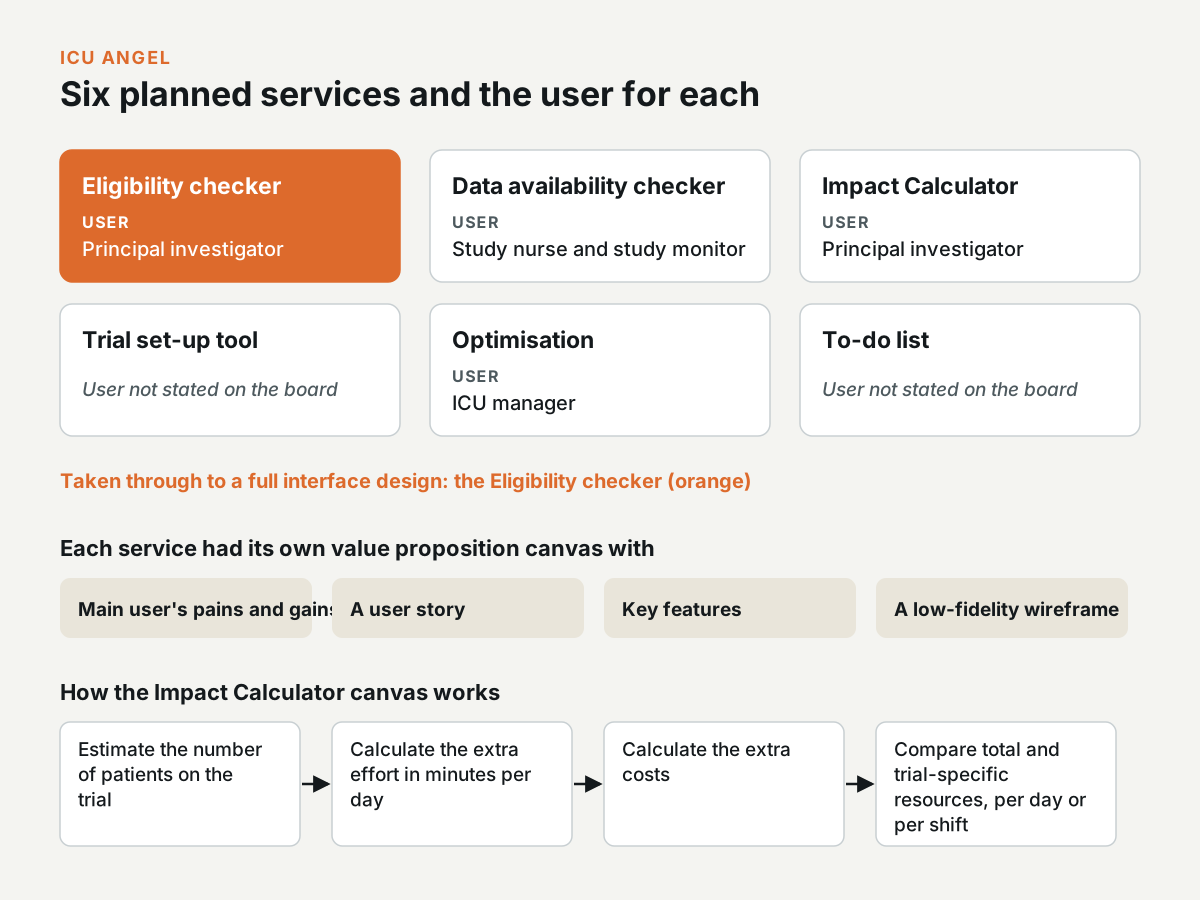
ICU Angel was planned as a suite of six services: an Eligibility checker, a Data availability checker, an Impact Calculator, a Trial set-up tool, Optimisation, and a To-do list.
I mapped the services on value proposition canvases, one for each service. Each canvas has the main user's pains and gains, a user story, the key features, and a low-fidelity wireframe. The principal investigator is the user for the Impact Calculator and the Eligibility checker. The Data availability checker is for the study nurse and the study monitor, and Optimisation is for the ICU manager.
For the Impact Calculator, the canvas starts from an estimate of the number of patients on the trial. It then calculates the extra effort in minutes per day and the extra costs, and it compares the total resources with the trial-specific ones, per day or per shift, for resource planning.
The Eligibility Checker is the service I took through to a full interface design, and the rest of this tab is about it.
Mapping the clinical study journey
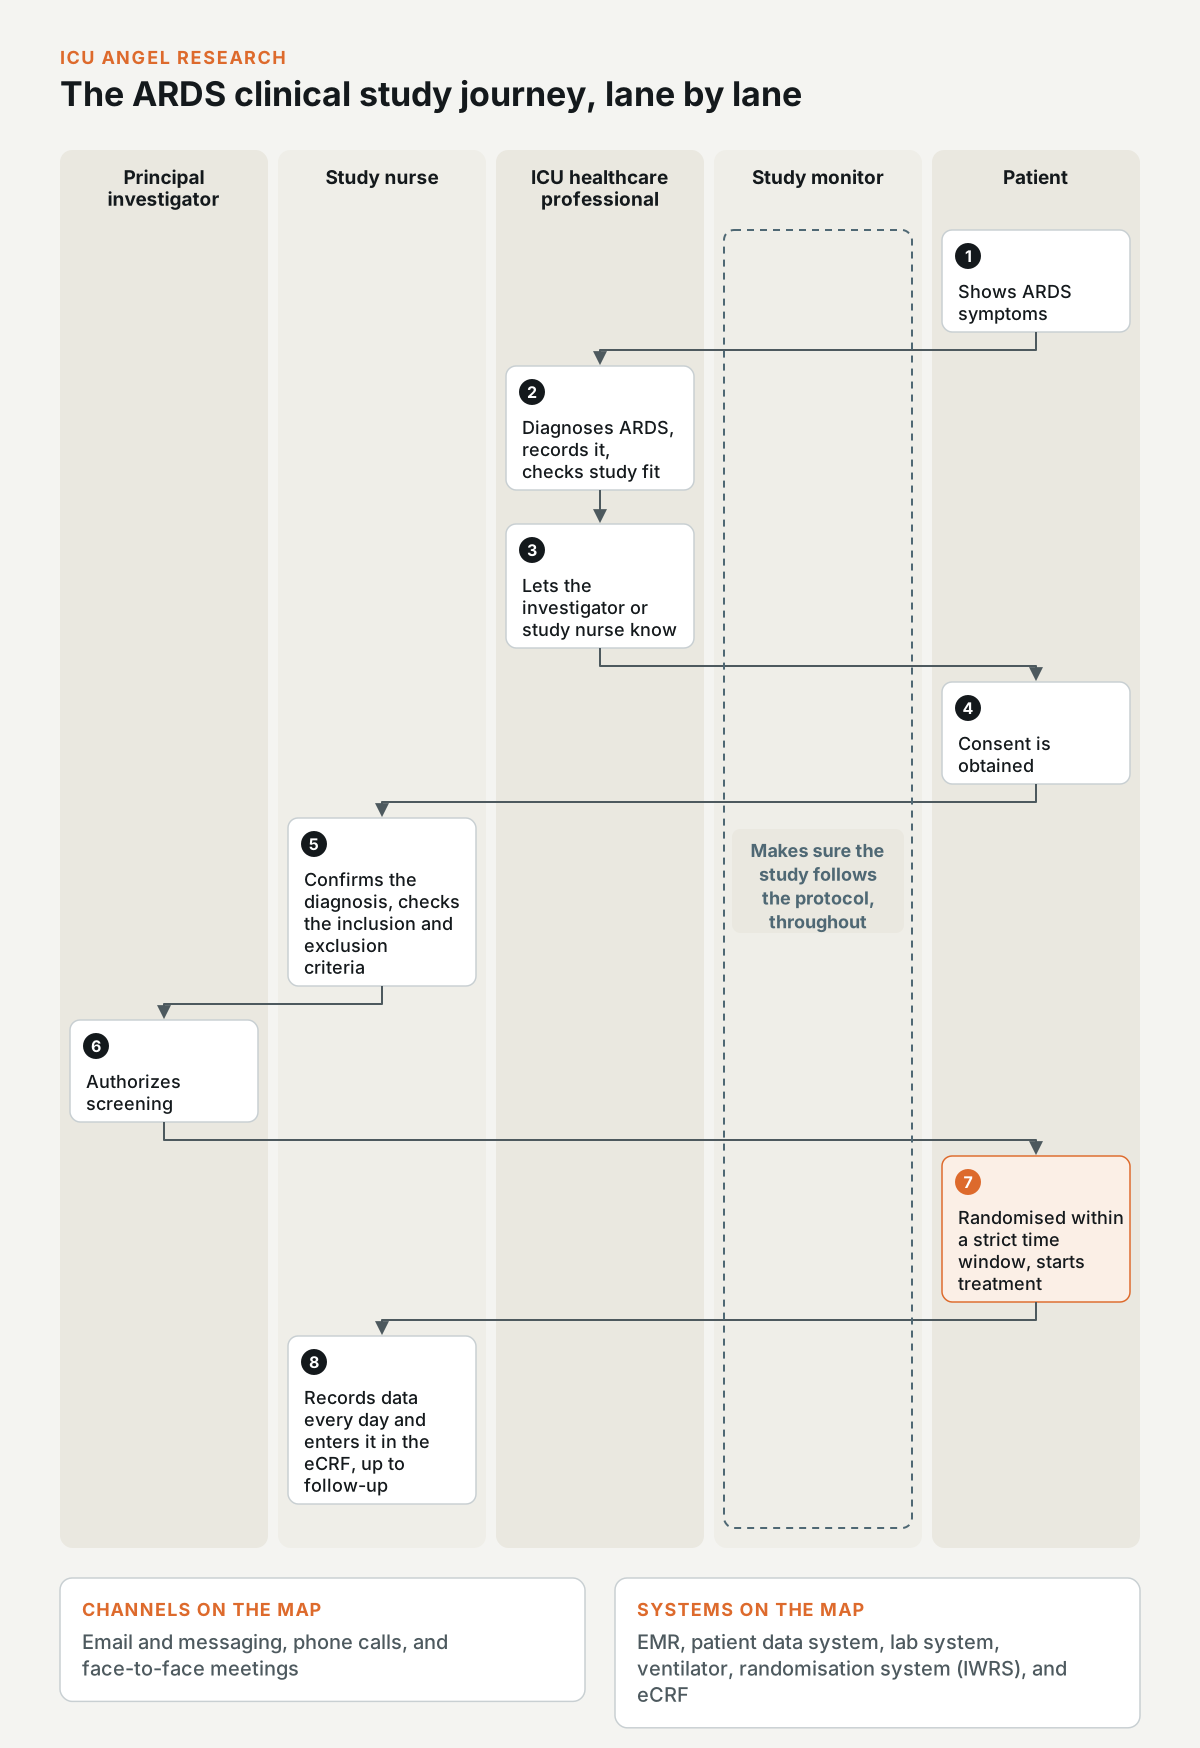
To find the points where trial recruitment breaks down in the ICU, I mapped the journey of an ARDS clinical study as a swimlane map, with a lane for each role: the principal investigator, the study nurse, the ICU healthcare professional, the study monitor, and the patient. The ICU healthcare professionals often aren't part of the research team, but they're the ones who spot possible participants and care for them.
The journey starts when a patient shows ARDS symptoms and an ICU clinician makes the diagnosis and records it. The clinician checks if the patient could fit the study and lets the principal investigator or the study nurse know. After that, consent is obtained, the study nurse confirms the diagnosis and checks the inclusion and exclusion criteria, and the principal investigator authorizes screening. Once the patient is included, they're randomised within a strict time window and start the study treatment. The team then records data every day and enters it in the eCRF, up to the follow-up assessments at the end of the study.
The map also lists the channels for each step, such as email and phone calls, and the systems involved, from the EMR and the lab system to the randomisation system and the eCRF.
Pain points on the study journey
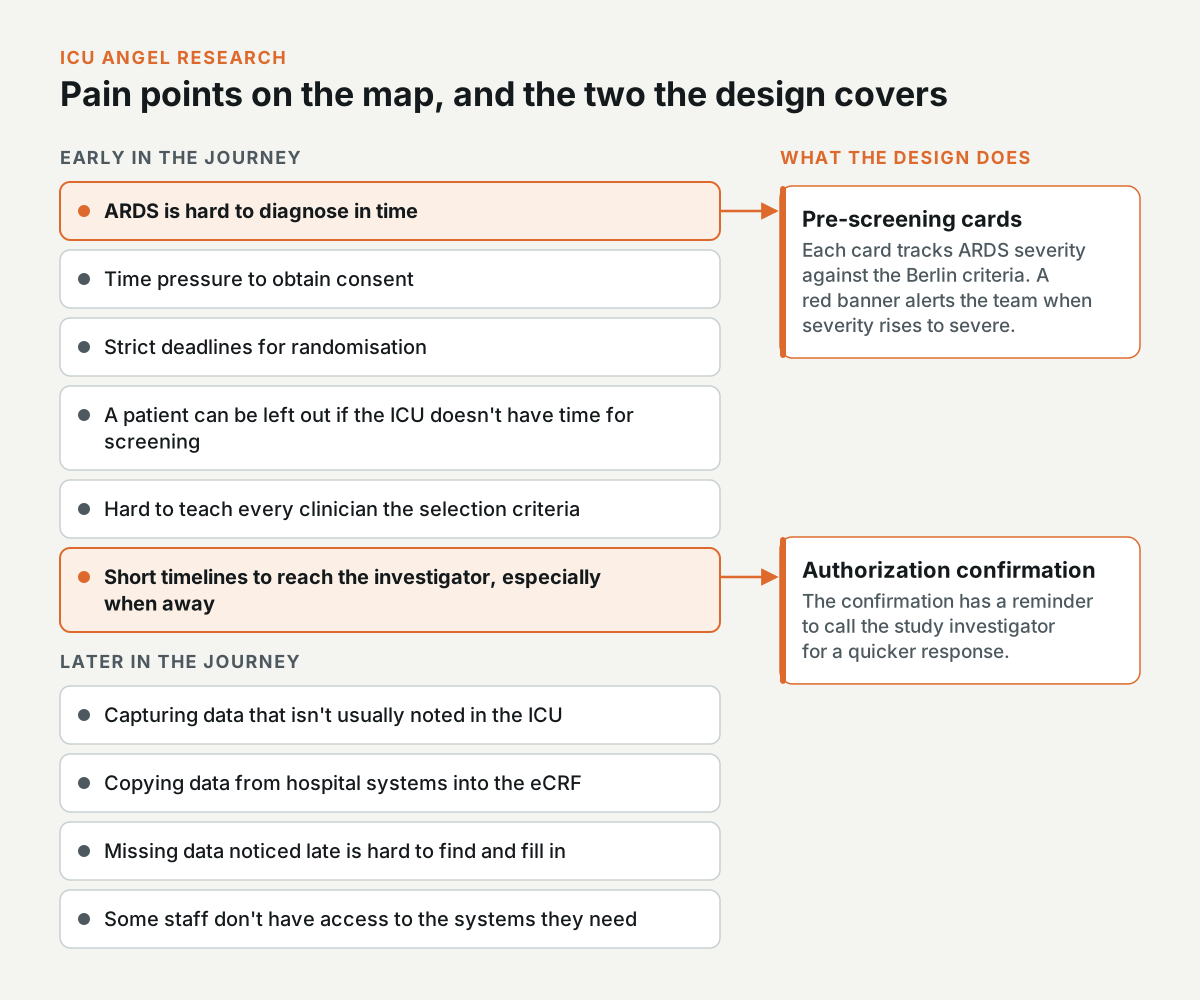
The pain points on the map come from every stage. ARDS is hard to diagnose in time, and after the diagnosis, the team works under time pressure to obtain consent and strict deadlines for randomisation. A patient can be left out of the study if the ICU doesn't have time for screening. It's hard to teach every clinician in the ICU the selection criteria, and the timelines to reach the investigator are short, especially when the investigator is away.
Later in the journey, the team has to capture data that isn't usually noted in the ICU and copy it from the hospital systems into the eCRF. When missing data is noticed late, it's hard to find and fill in, and some staff don't have access to the systems they need.
The Eligibility Checker covers two of these pain points directly. For the late diagnosis, the pre-screening cards track ARDS severity against the Berlin criteria, and a red banner alerts the team when a patient's severity rises to severe. For the short timelines to reach the investigator, the confirmation of an authorization request has a reminder to call the study investigator for a quicker response.
Who I designed for
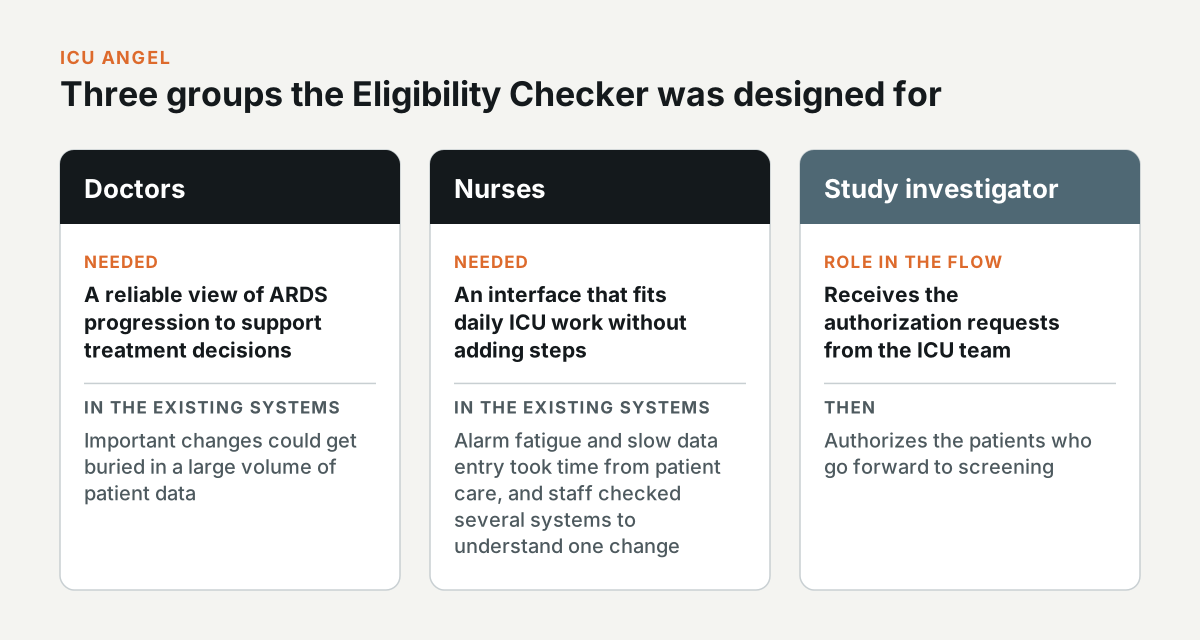
Doctors needed a reliable view of ARDS progression to support their treatment decisions. In the existing systems, important changes could get buried in a large volume of patient data.
Nurses needed an interface that fits daily ICU work without adding steps. Alarm fatigue and slow data entry were taking time away from patient care, and nurses and doctors had to check several systems to understand a change in a patient's status.
The study investigator receives the authorization requests from the ICU team and authorizes the patients who go forward to screening.
Research with ICU staff
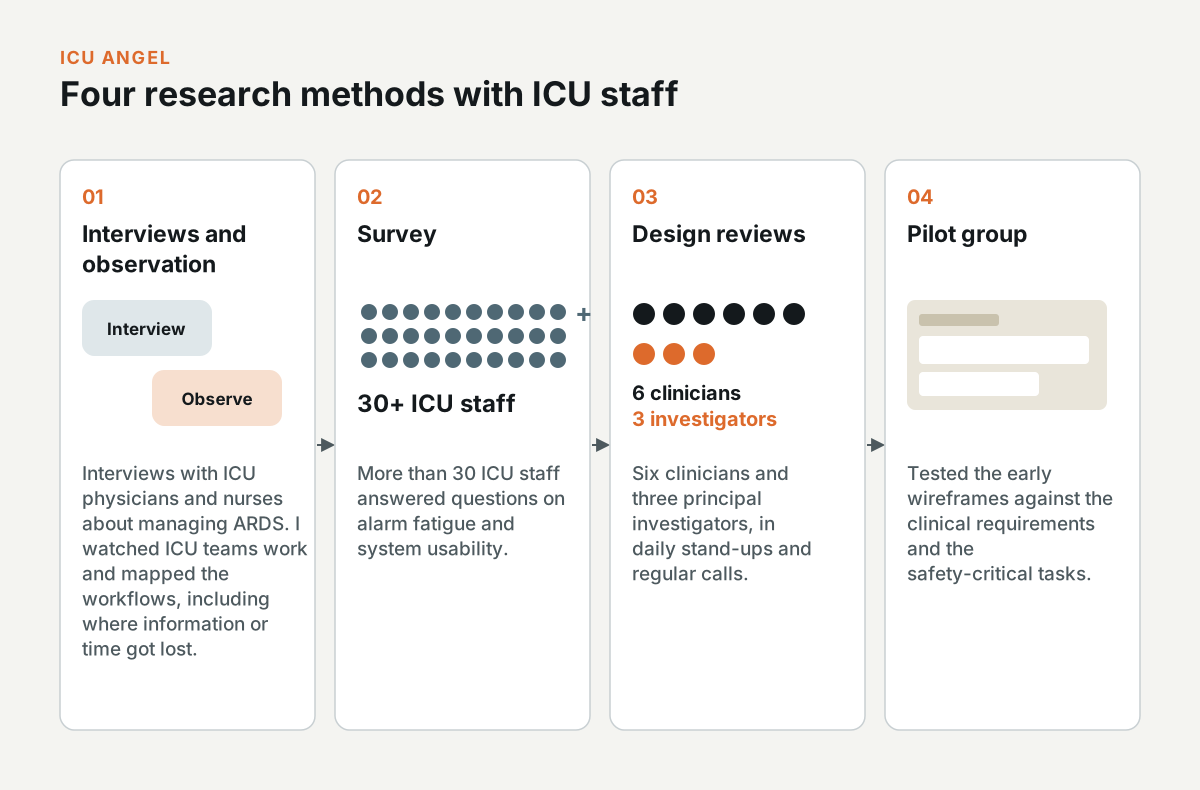
I started with interviews with ICU physicians and nurses about the problems they faced while managing ARDS. I also watched how ICU teams worked and mapped the existing workflows, including the points where information or time got lost.
More than 30 ICU staff answered a survey about alarm fatigue and system usability.
Six clinicians and three principal investigators reviewed the designs with me in daily stand-ups and regular calls. A pilot group tested the early wireframes against the clinical requirements and the safety-critical tasks.
Pre-screening
To enrol a patient in an ARDS trial, the ICU team has to notice early that the patient is developing ARDS, and then get the diagnosis and the screening authorization in place. Pre-screening is the page where the team does this.
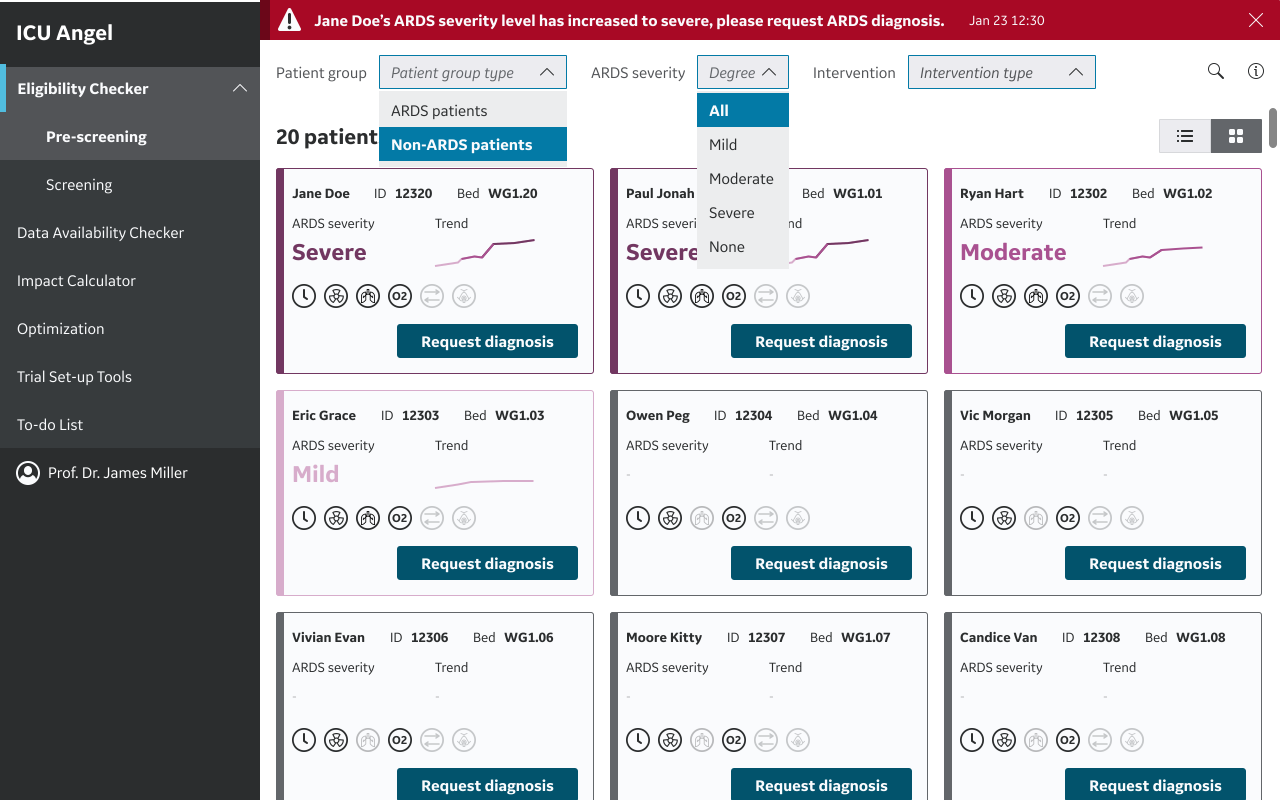
The page opens on the Non-ARDS patients group, with a card for each patient. The card has the patient's ID and bed, the ARDS severity, and a trend line of how the severity has changed. Under the severity, a row of icons covers the Berlin criteria, the clinical definition of ARDS: timing, chest imaging, the origin of the respiratory failure, and oxygenation. An icon is greyed out while that criterion isn't met.
How the cards show ARDS severity
Before the redesign, the screen used traffic-light colours everywhere, and none of the colours stood out. For ICU Angel, I gave ARDS severity its own colour ramp, from pale pink for Mild to dark plum for Severe, and the same colour runs down the left edge of each card. A dash means the patient doesn't have a severity score yet.
Red only appears on the critical alert banner and on values that need attention, such as a failed trial criterion or a long time after diagnosis.
From the prototype reviews, the team's own estimate was that clinicians took about 30 seconds to spot a critical change on the old screen, and less than 5 seconds with the new visual hierarchy.
Alerts, diagnosis requests, and authorization requests
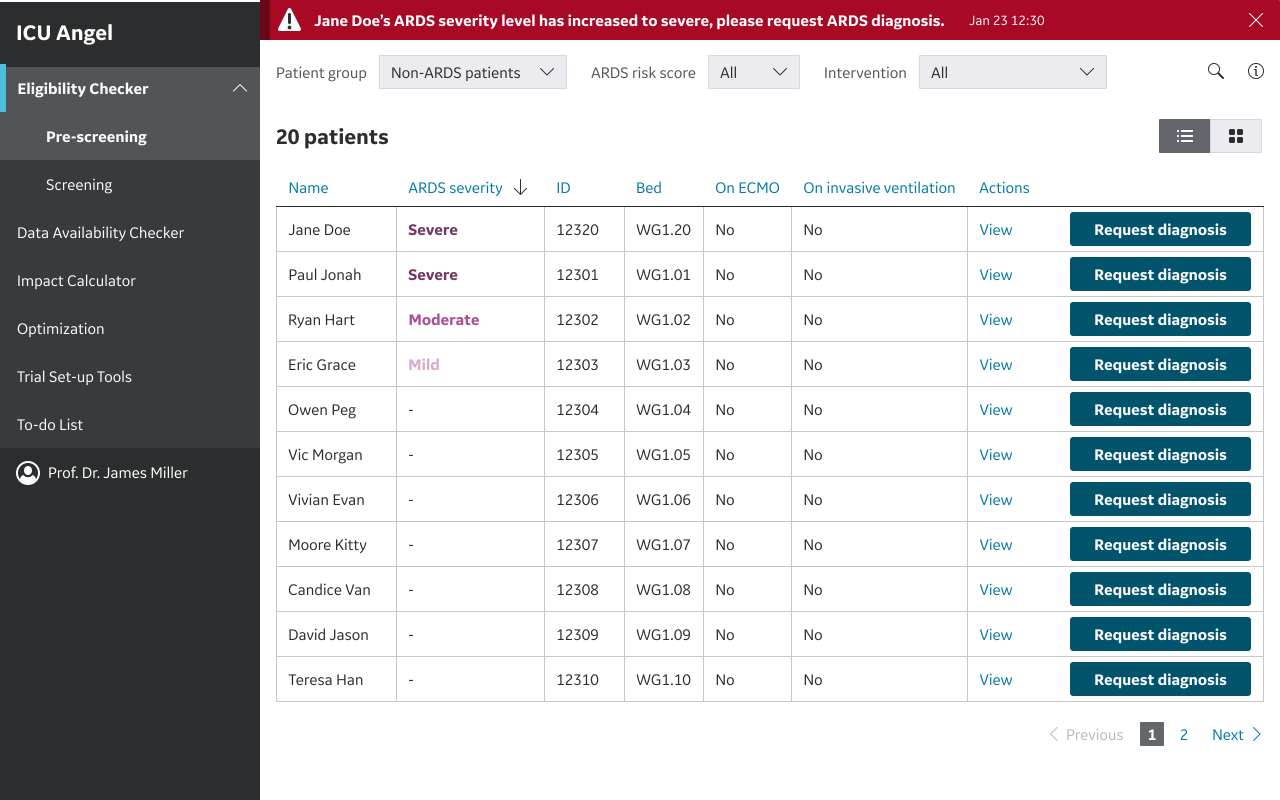
I used two banner styles. A red banner with a warning triangle is for a critical change, for example: "Jane Doe's ARDS severity level has increased to severe, please request ARDS diagnosis." A grey-blue banner with an info icon is for status updates, like a confirmed diagnosis. This way, the clinician picks out a critical change by its colour and its icon.
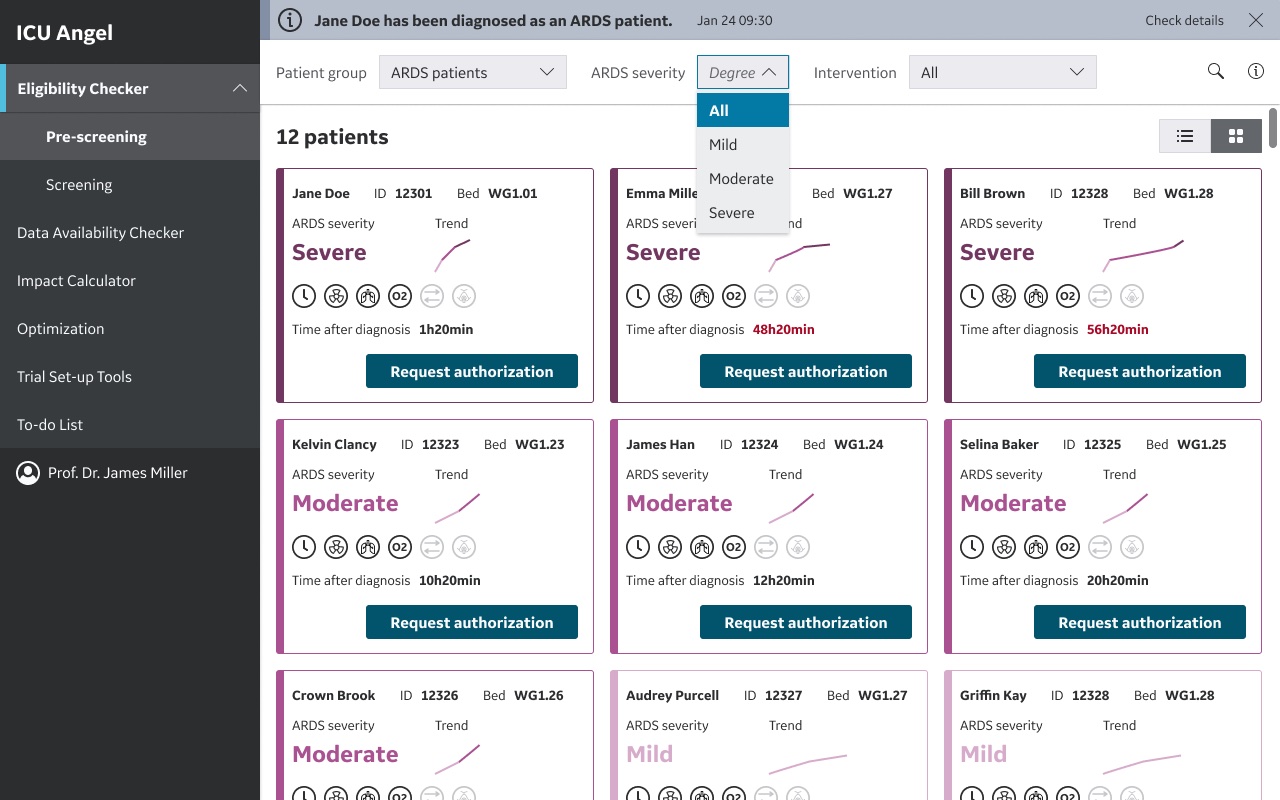
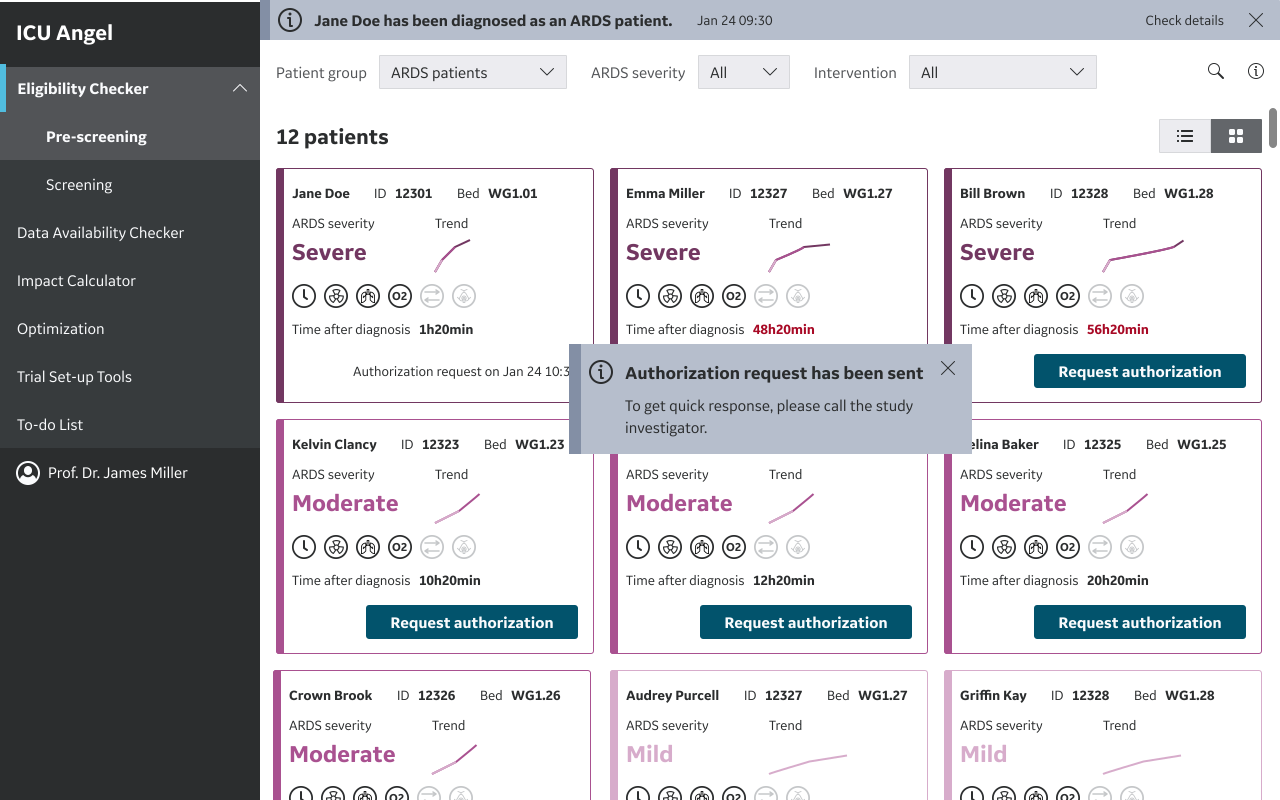
Each card in the Non-ARDS group has a Request diagnosis button. Once the patient is diagnosed, they move to the ARDS patients group. There, the card shows the time after diagnosis, and the button changes to Request authorization. Longer times, like 48h20min, are in red.
Request authorization sends the request to the study investigator. A confirmation appears with a reminder to call the study investigator for a quicker response, and the card shows the date and time of the request in place of the button.
Finding a patient
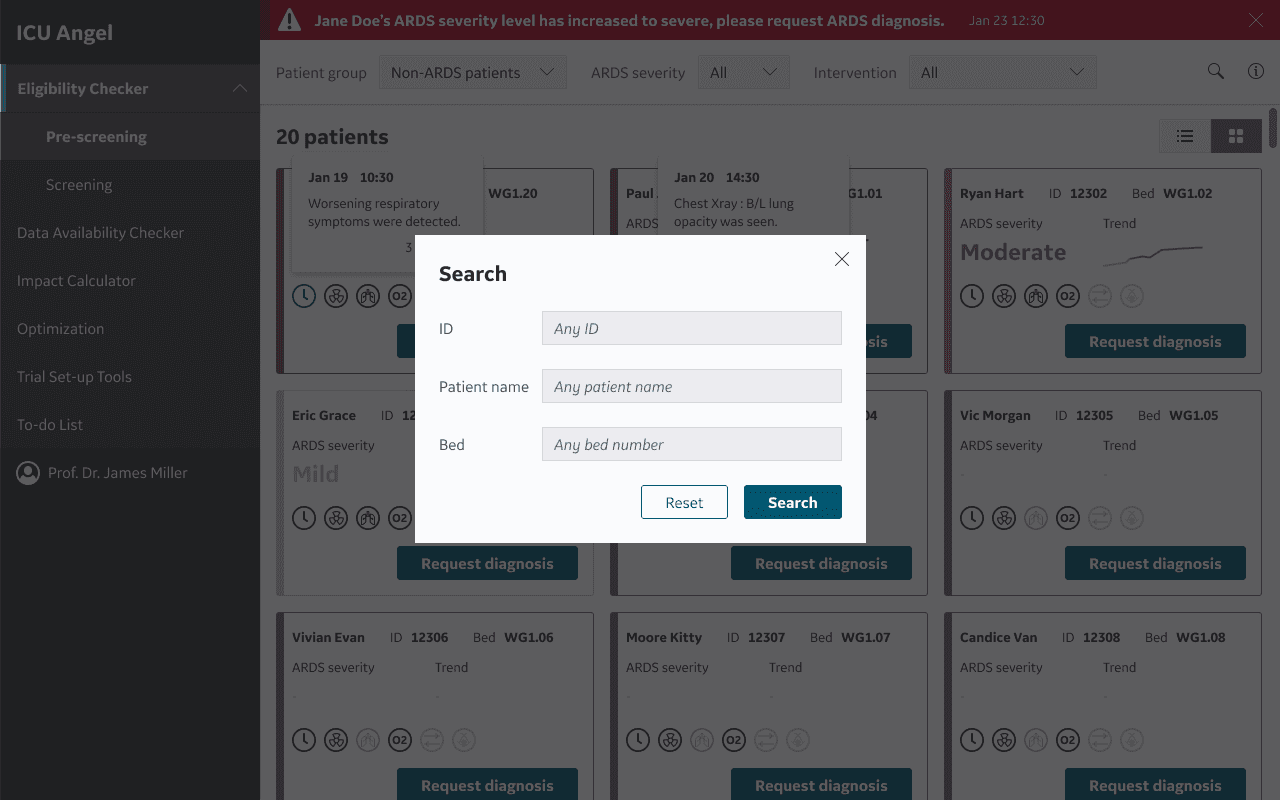
Each patient group switches between cards and a list. The list adds two columns, On ECMO and On invasive ventilation, and it sorts by ARDS severity. Filters at the top narrow the patients by group and ARDS severity, and a search modal looks up a patient by name or by bed number.
The Development timeline
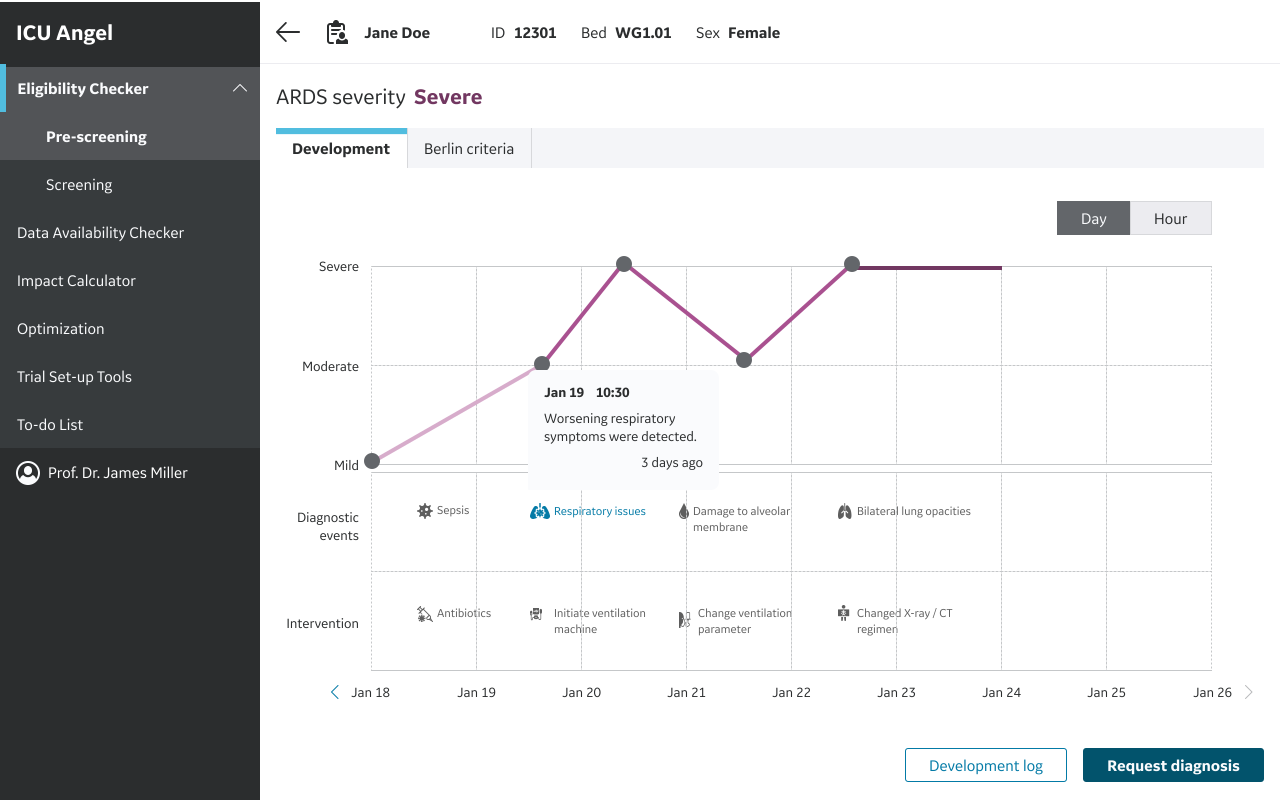
Before a clinician requests an ARDS diagnosis, they need to understand how the patient got to this point. When they open a patient from pre-screening, the Development tab has a timeline of the patient's ARDS severity, by day or by hour, in bands from Mild to Severe.
Under the chart, two lanes follow the same dates. Diagnostic events lists findings such as sepsis and bilateral lung opacities. Intervention lists steps such as starting ventilation and changing the ventilation parameters. Hovering over a point on the line opens the event and its time, for example "Jan 19 10:30, Worsening respiratory symptoms were detected."
I put the events and the interventions on the same time axis as the severity line. This way, the clinician reads a jump from Moderate to Severe next to the findings and the ventilation changes from the same days.
The Berlin criteria evidence
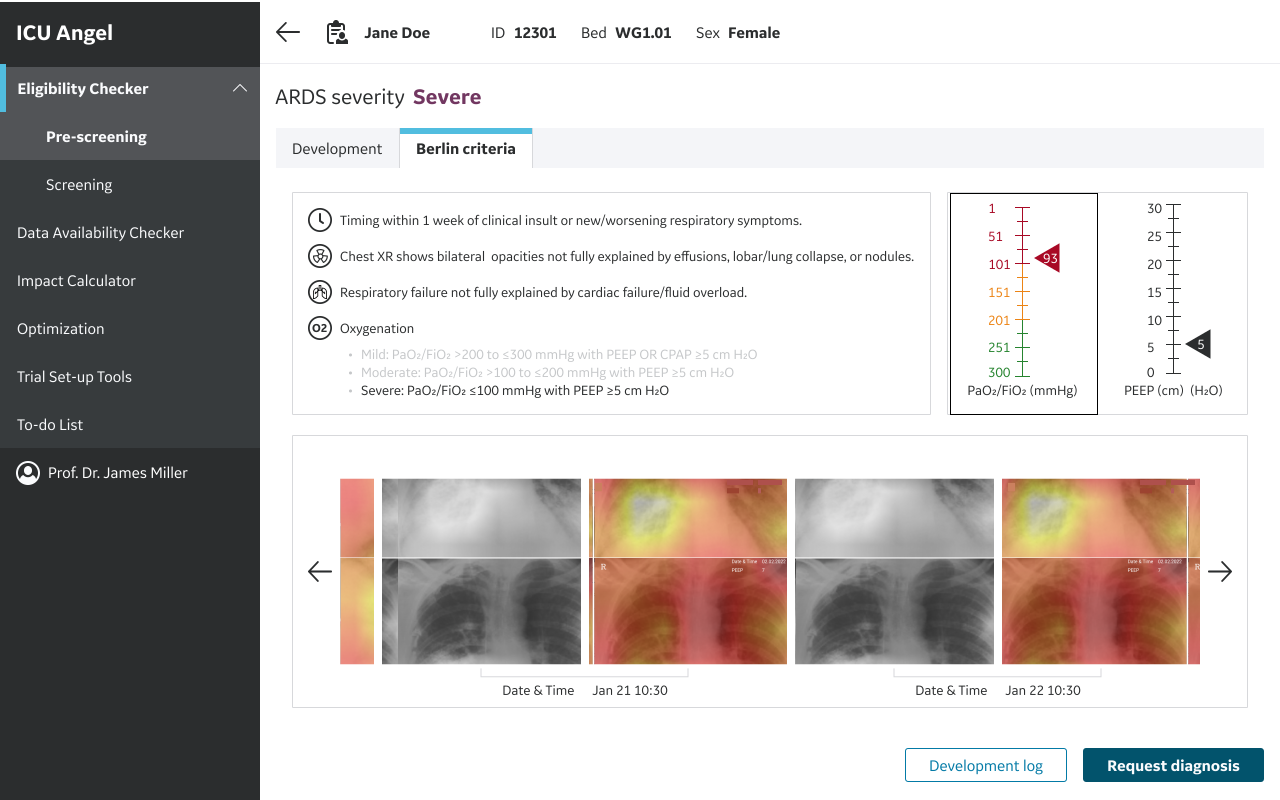
The Berlin criteria tab sets out the evidence for the diagnosis. The checklist covers the four criteria: timing within one week of the clinical insult, bilateral opacities on the chest X-ray, respiratory failure that cardiac failure or fluid overload doesn't fully explain, and oxygenation. Under oxygenation, the band that matches the patient is in bold, and the other two are greyed out.
Next to the checklist, two vertical gauges show the PaO2/FiO2 ratio in mmHg and the PEEP in cm H2O, with a pointer at the current value. The PaO2/FiO2 scale runs from red at the low end to green at 300, the upper limit for mild ARDS in the Berlin definition. For the sample patient, the pointer is at 93, in the severe range.
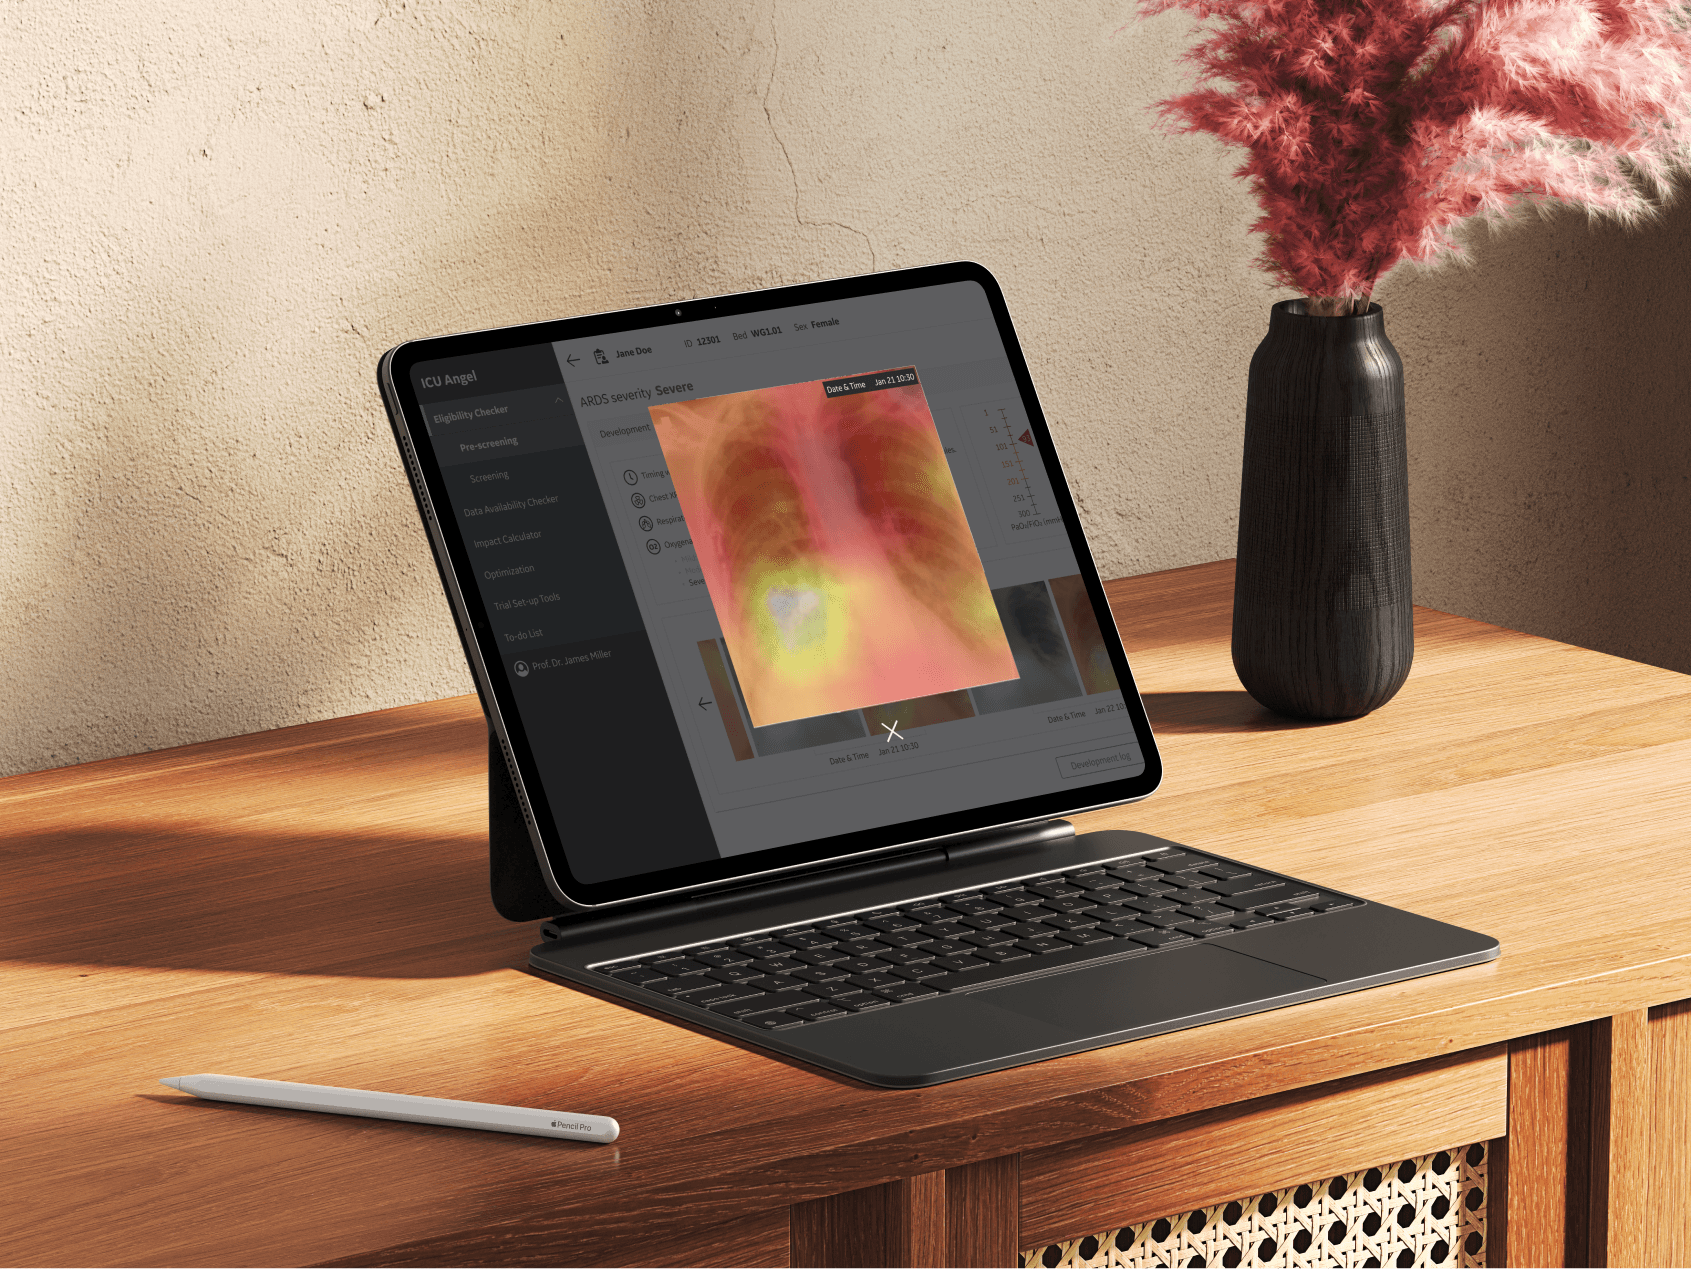
Below that, the imaging carousel pairs each chest X-ray with a heat-map overlay, with the date and time under each pair. Tapping an image opens it full screen.
Both tabs end with the Development log and Request diagnosis buttons. A clinician who has just checked the evidence requests the diagnosis from the same page, without going back to the patient list.
The screening list
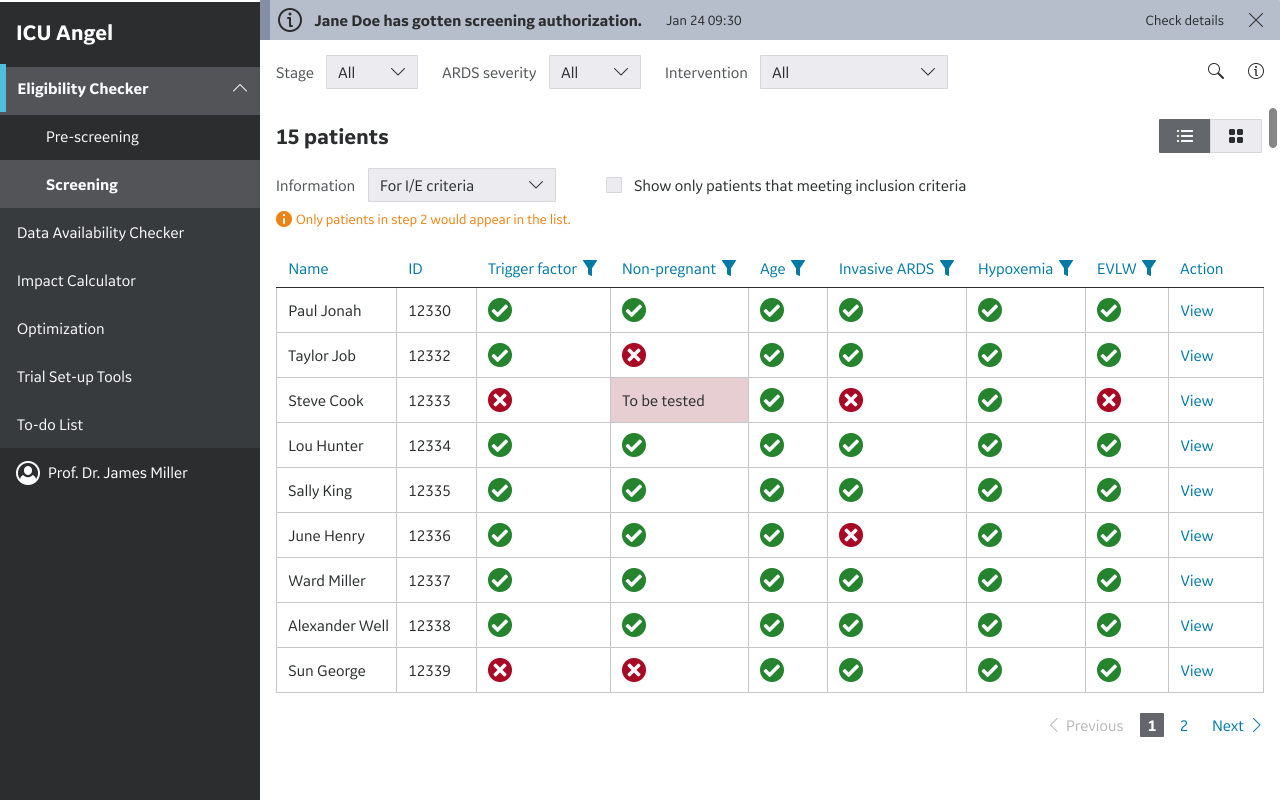
When the study investigator authorizes screening, a grey-blue banner confirms it, and the patient moves to the Screening page. The list only includes patients at step 2 of the trial flow, and I put an orange note above the table to make that clear.
Each row is a patient, and each column is one of the trial criteria: the trigger factor, non-pregnancy, age, invasive ARDS, hypoxemia, and EVLW. A cell has a green check when the patient meets the criterion, a red cross when they don't, and a pink To be tested cell when the result isn't in yet. Every column has its own filter, and a checkbox limits the list to the patients who meet the inclusion criteria.
Checking one patient against the trial criteria
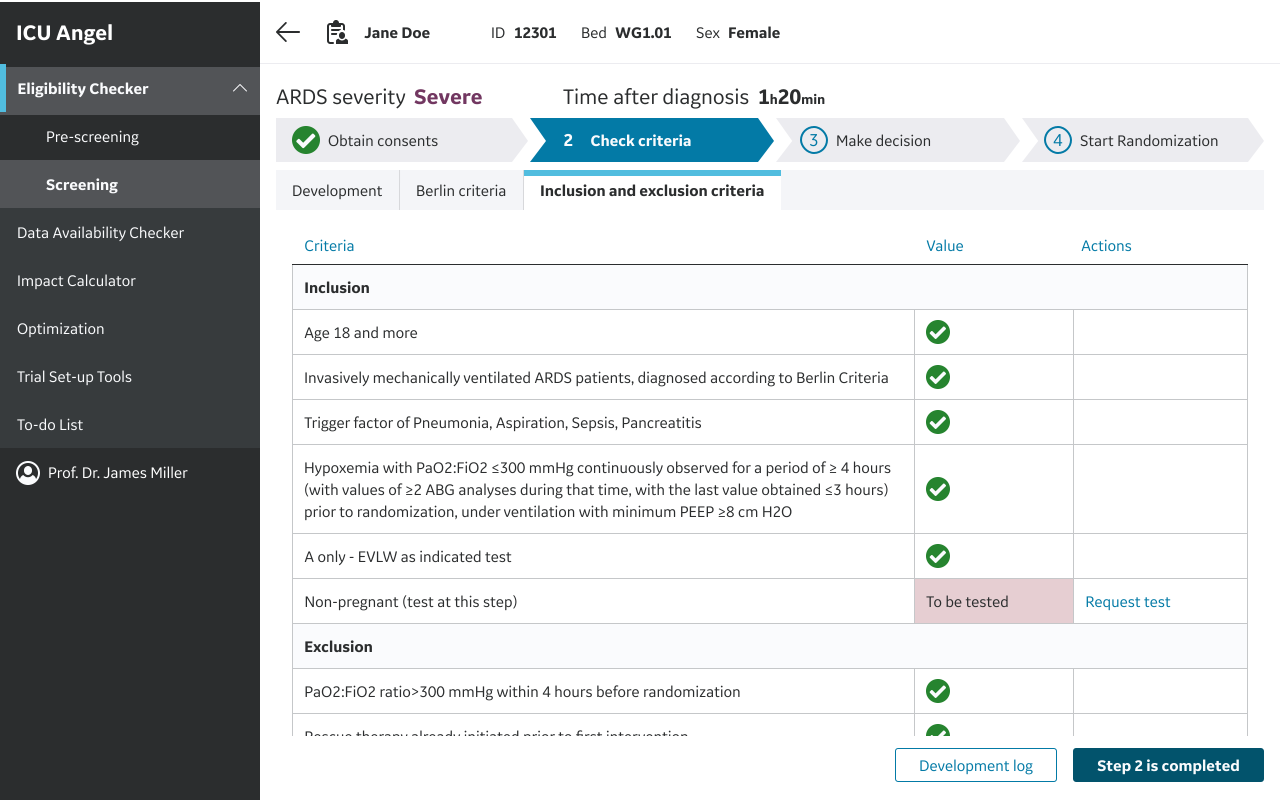
Opening a patient from the list brings up a four-step flow at the top of the page: Obtain consents, Check criteria, Make decision, and Start Randomization. The time after diagnosis is next to the ARDS severity, because several criteria have time windows.
The Inclusion and exclusion criteria tab lists each criterion with its value. When a value is still missing, like the pregnancy test, the row has To be tested and a Request test link. After the test, the clinician presses Step 2 is completed, and the flow moves on to Make decision.
The Development and Berlin criteria tabs from pre-screening are on this page too, and the clinician reviews the same evidence during screening.
Setting up the trial criteria
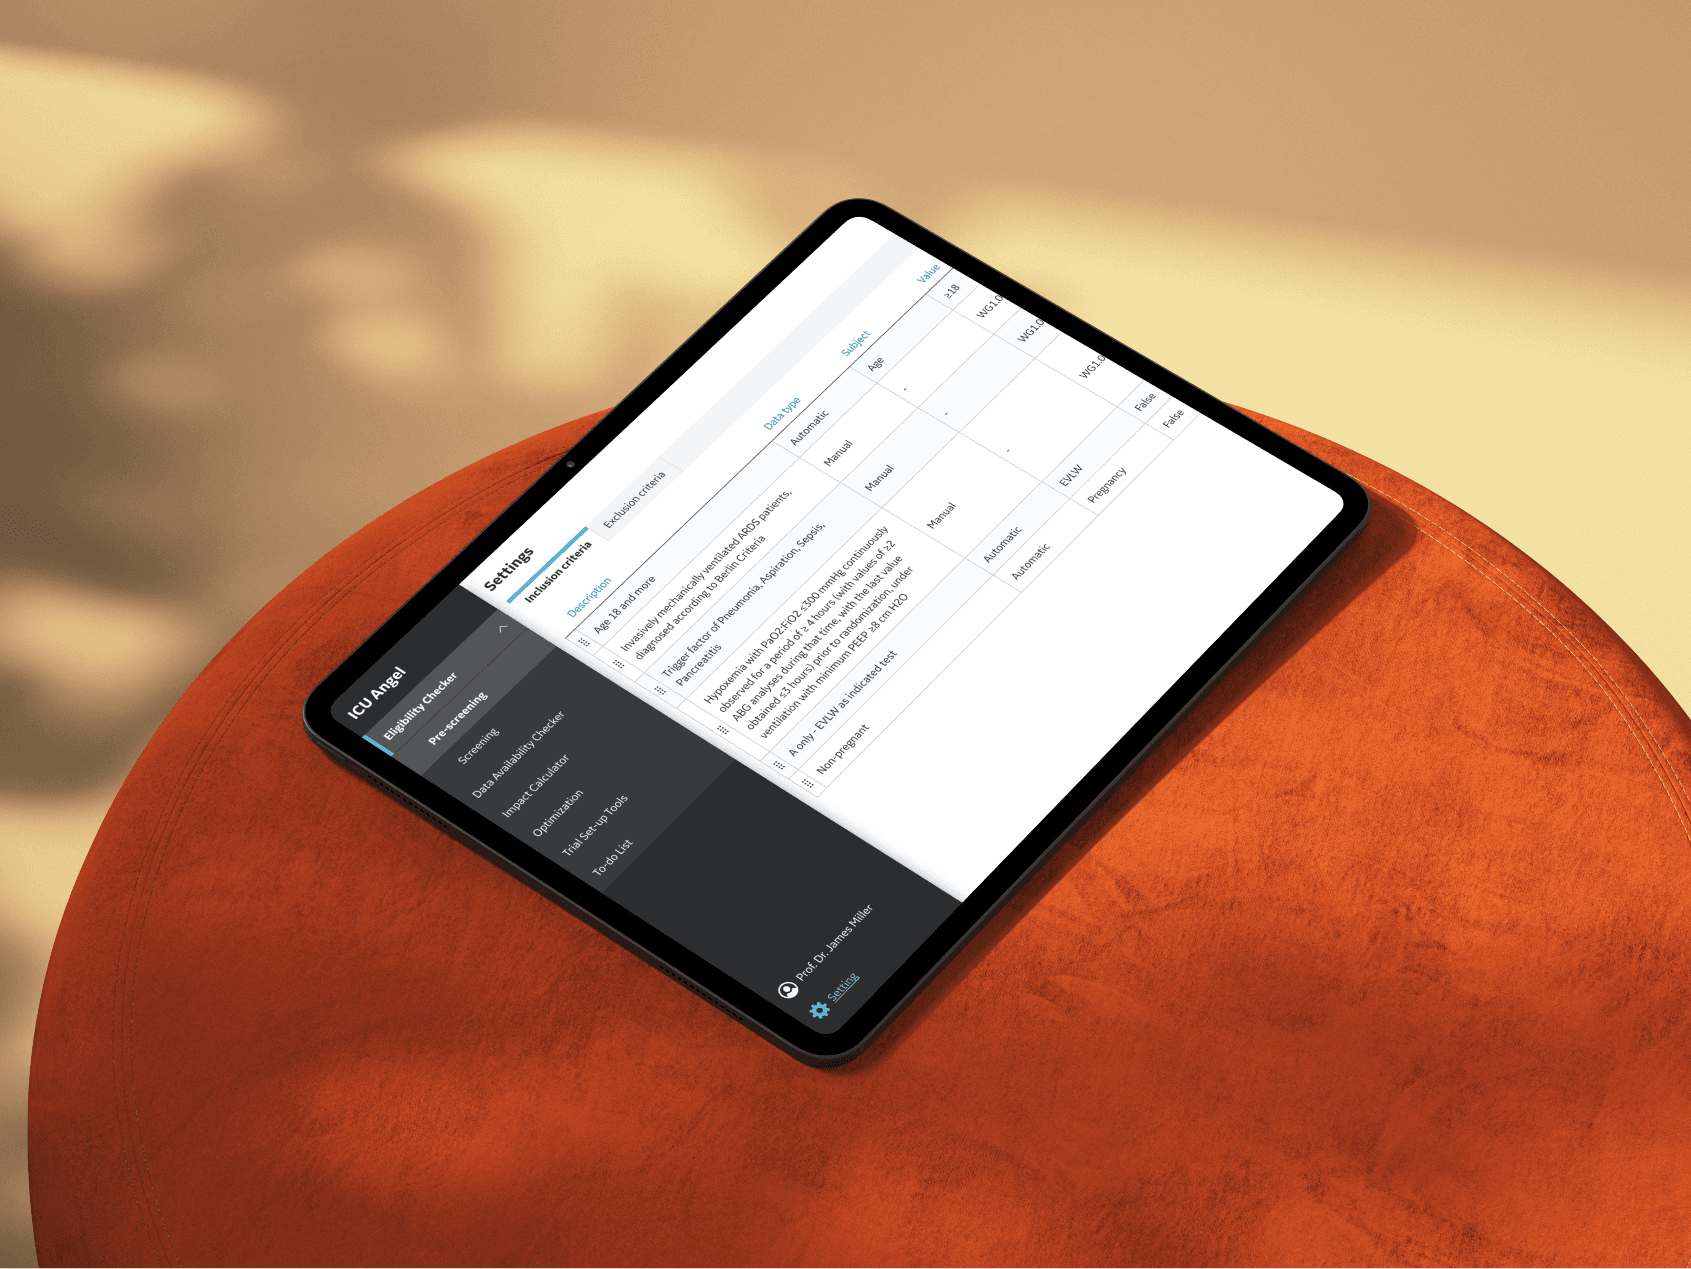
A Settings page lists the inclusion criteria and the exclusion criteria on separate tabs, and each criterion is marked as automatic or manual.
Testing the ICU Angel prototype
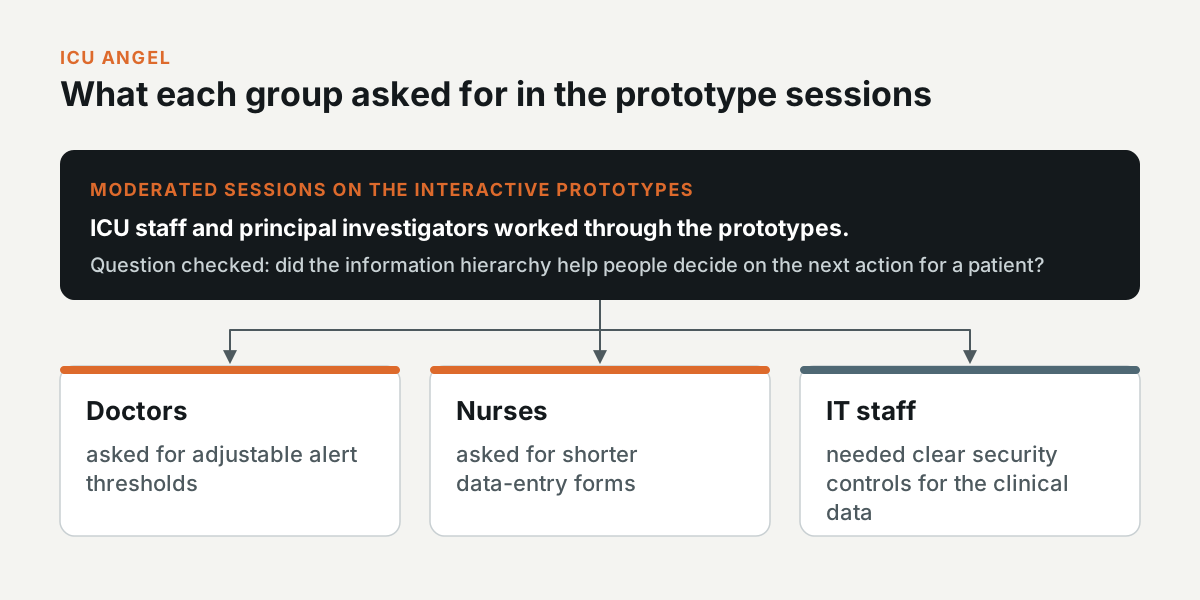
ICU staff and principal investigators then worked through the interactive prototypes in moderated sessions. I used these sessions to check if the information hierarchy helped people decide on the next action for a patient.
Doctors asked for adjustable alert thresholds, and nurses asked for shorter data-entry forms. IT staff needed clear security controls for the clinical data.
The ICU Angel pilot
Once the design was complete and the MVP was built, the platform went into a pilot. ICU Angel is estimated to save up to 2 million lives a year. That estimate is for the platform as a whole, and I don't claim it as a result of the interface design on its own.
What FemHub is
Interactive prototype: Open the prototype. Try this: Press Book Screening and book a screening, then open the Apps tab and install an app from the guide.
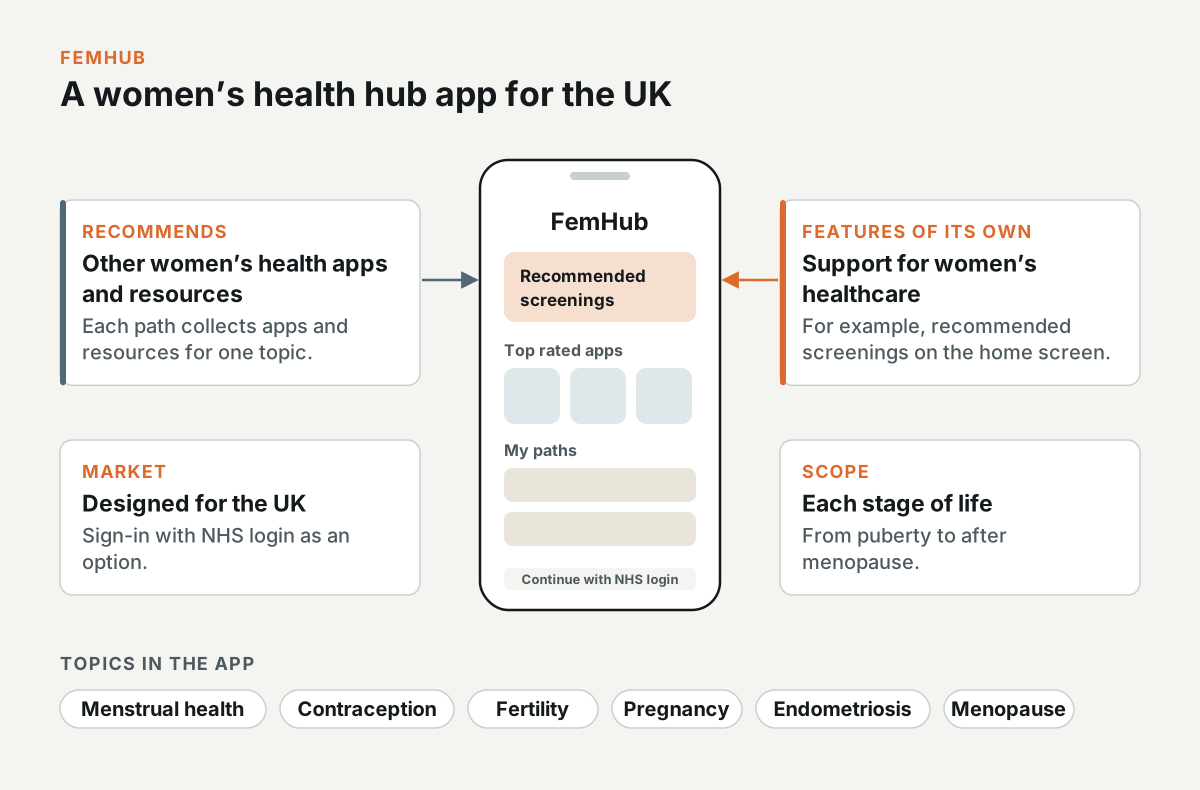
FemHub was a women's health hub app that Bayer was designing for the UK, with NHS login. The app recommends other women's health apps and resources, and it has features of its own to support women's healthcare, such as recommended screenings. It covers women's health at each stage of life, with topics like menstrual health, contraception, fertility, pregnancy, endometriosis, and menopause.
I wrote the design scope, which included the first iteration of the screens, and I wrote the report on the first round of usability testing.
The FemHub design scope
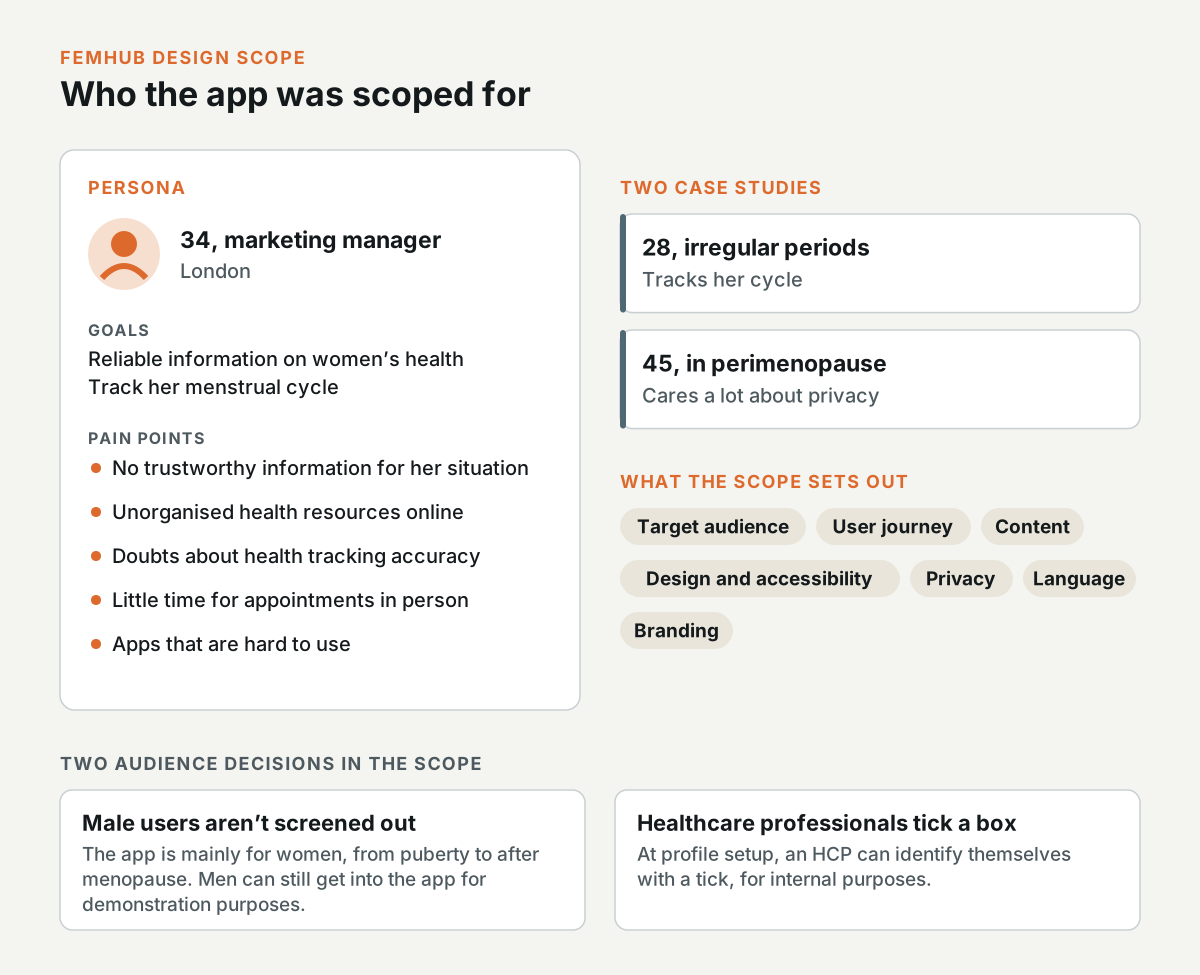
The scope starts with a persona: a 34-year-old marketing manager in London who wants reliable information on women's health and wants to track her menstrual cycle. Her pain points were a lack of trustworthy health information for her own situation, unorganised health resources online, doubts about the accuracy of health tracking tools, limited time for appointments in person, and apps that are hard to use.
The scope also has two case studies: a 28-year-old with irregular periods who tracks her cycle, and a 45-year-old in perimenopause who cares a lot about privacy.
In the scope, I then set out the target audience, the user journey, the content, design and accessibility, privacy, language, and branding. The app is mainly for women from puberty to after menopause, but it doesn't screen out male users, and they can still get into the app for demonstration purposes. During profile setup, healthcare professionals can identify themselves with a tick, for Bayer's internal purposes, and the app states that Bayer developed it.
The user flow and the first screens
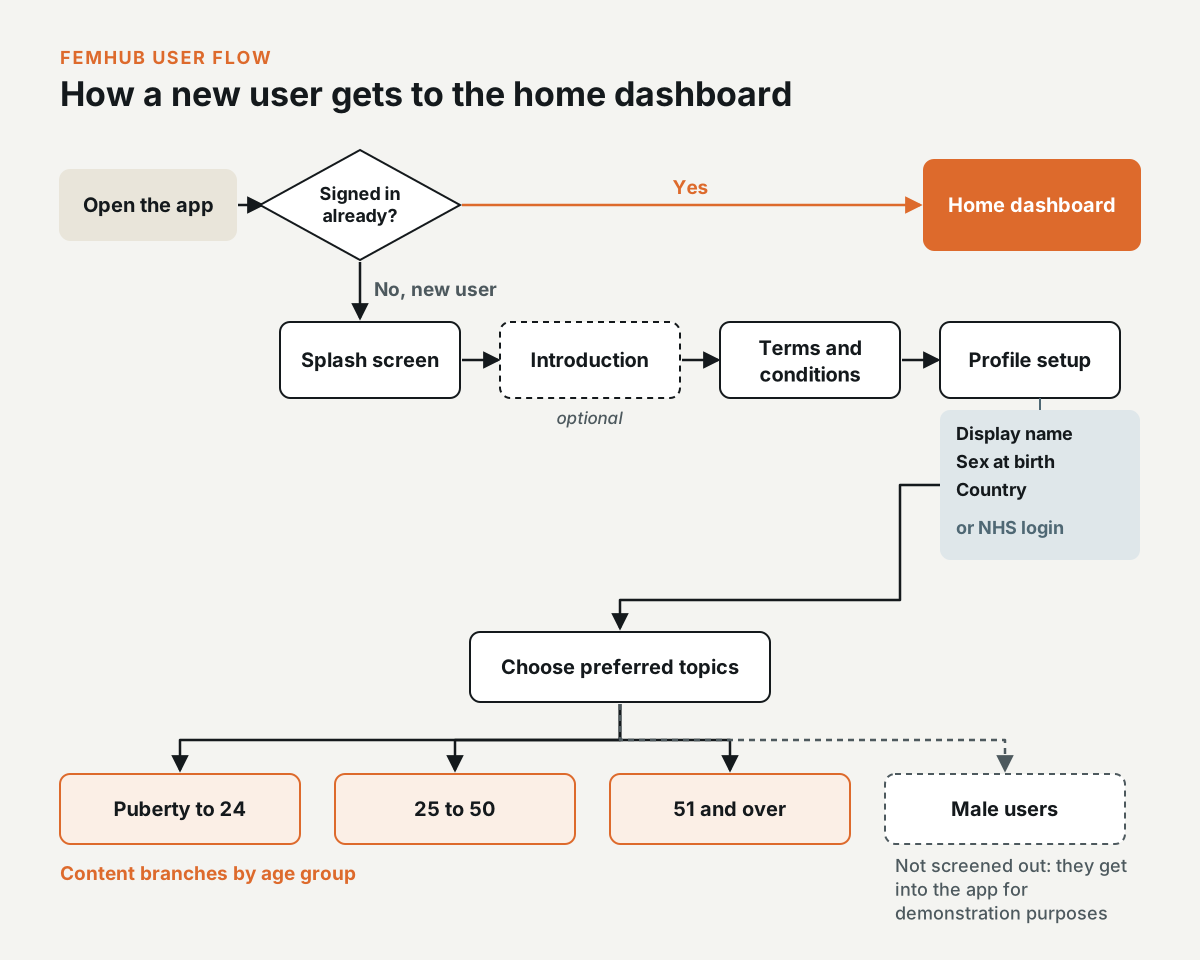
In the user flow, a signed-in user opens the app straight on the home dashboard. A new user goes from the splash screen through an optional introduction, the terms and conditions, and profile setup, where they enter a display name, their sex at birth, and their country, or use NHS login. They then choose their preferred topics in women's health, and the content branches by age group, from puberty to 24, 25 to 50, and 51 and over, with a separate branch for male users.
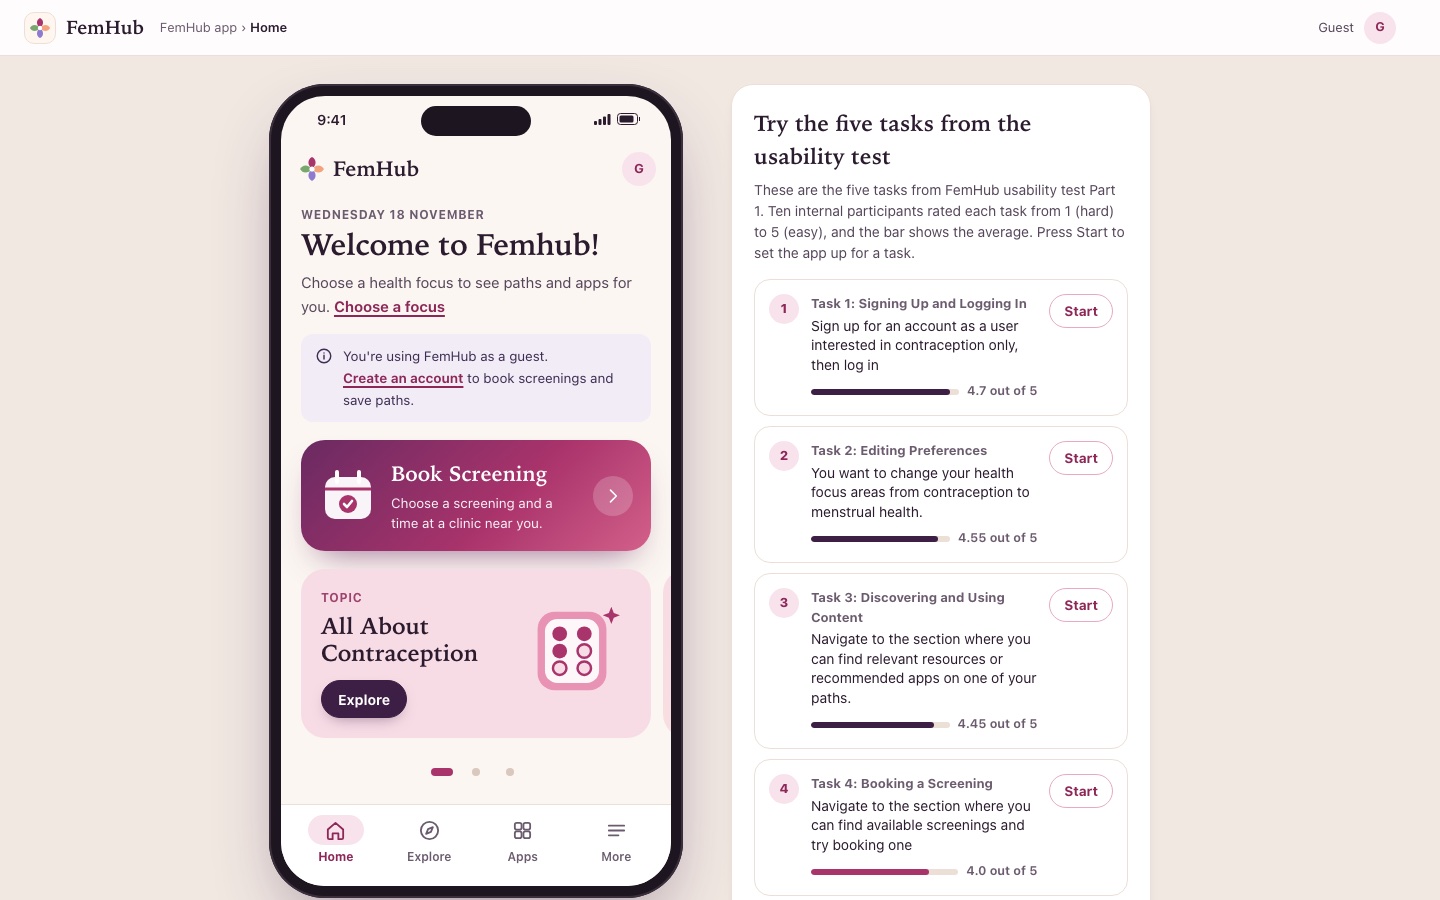
The home dashboard has featured apps and recommended screenings, with the user's paths below them. A path is a set of apps and resources for one topic, such as menstruation or menopause. In the first iteration, each path page listed a set of apps with a rating and an Open button.
The prototype that went into testing
The version that went into the usability test opens on a splash screen with Guest Login, Create an account, Continue with NHS login, and a link to sign in. The home screen shows the user's focus area with a link to change it, top rated apps, recommended screenings, and My Paths, which the user can edit. The bottom navigation has Home, Explore, Discover, and More.
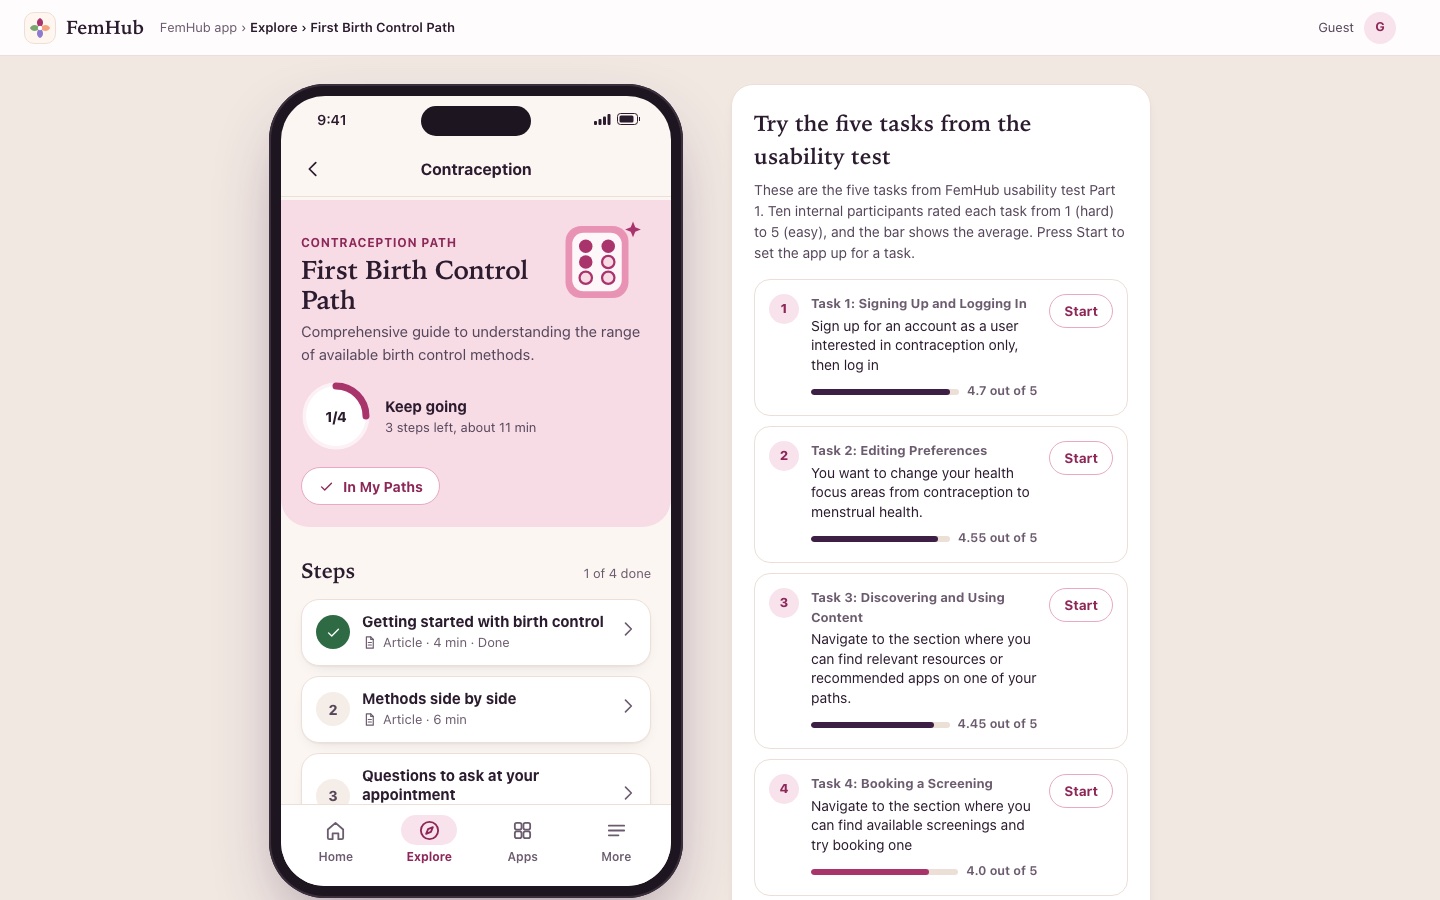
Each path opens a resource guide. The guide lists the recommended apps with a short description, a rating, an Install button, and a Review button. A note at the top of the guide makes clear that the apps and websites are external resources and that FemHub isn't affiliated with them.
How the FemHub usability test was set up
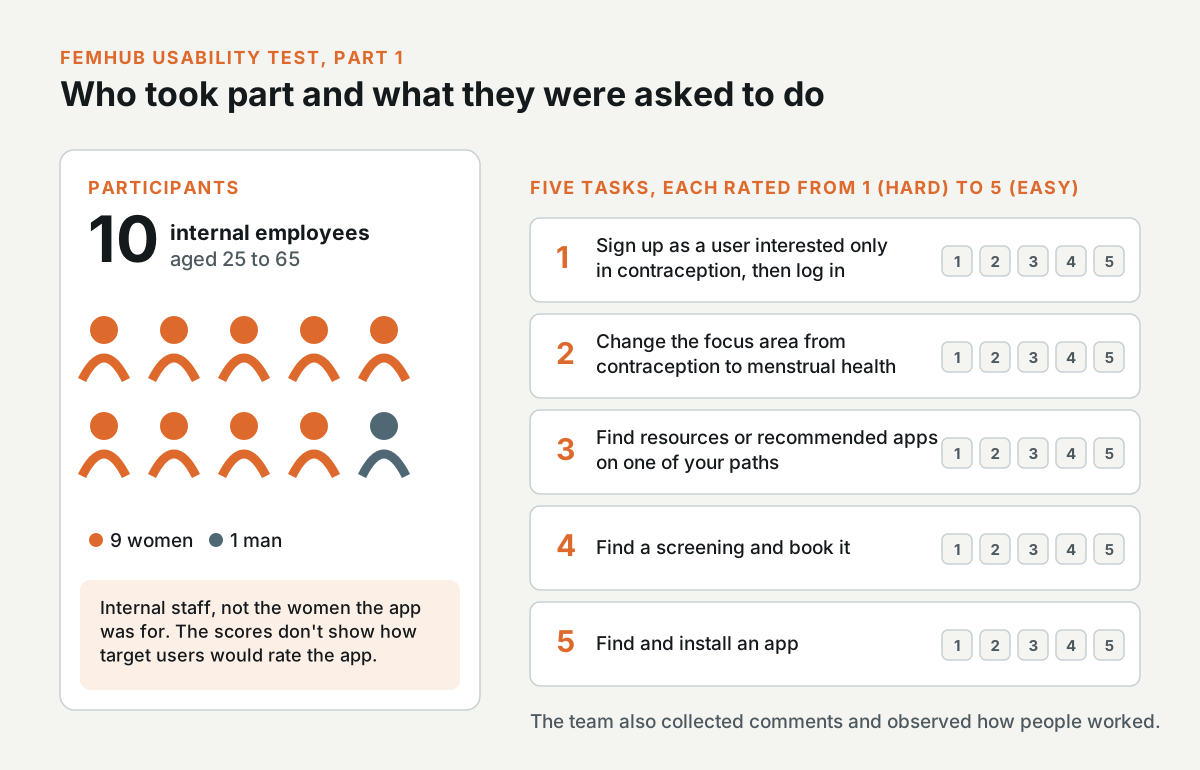
The aim of the test was to evaluate the usability of the prototype and find its pain points, including how efficiently people completed each task. The participants were 10 Bayer employees, 9 women and 1 man, aged 25 to 65, in roles such as product manager and health economist. They were internal staff, not the women the app was for, so the scores don't show how the target users would rate the app.
Each participant did five tasks: signing up as a user interested only in contraception and then logging in, changing their focus area from contraception to menstrual health, finding resources or recommended apps on one of their paths, finding a screening and booking it, and finding and installing an app. After each task, they rated how easy it was from 1 (hard) to 5 (easy), and the team collected their comments and observed how they worked.
Task scores from the first round
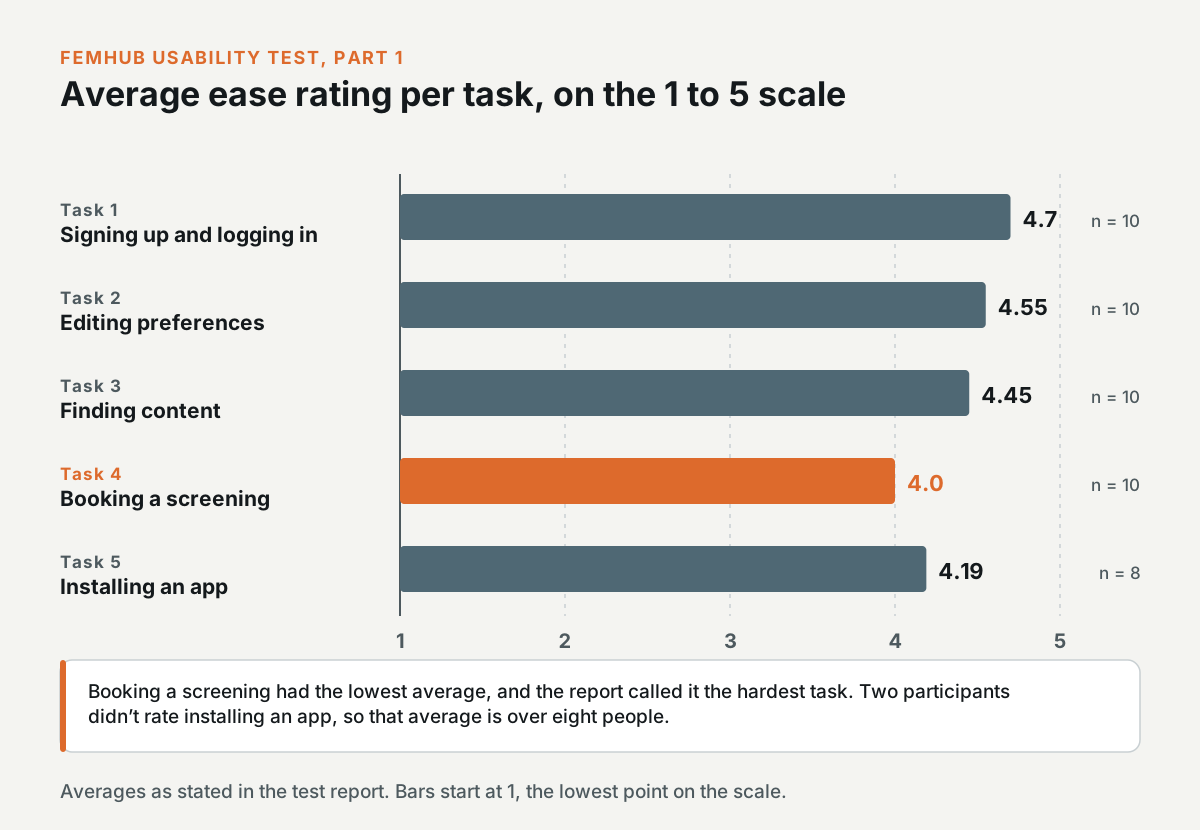
The averages in the report were 4.7 for signing up and logging in, 4.55 for editing preferences, 4.45 for finding content, 4.0 for booking a screening, and 4.19 for installing an app. Two participants didn't rate the app installation task, so that average is over eight people.
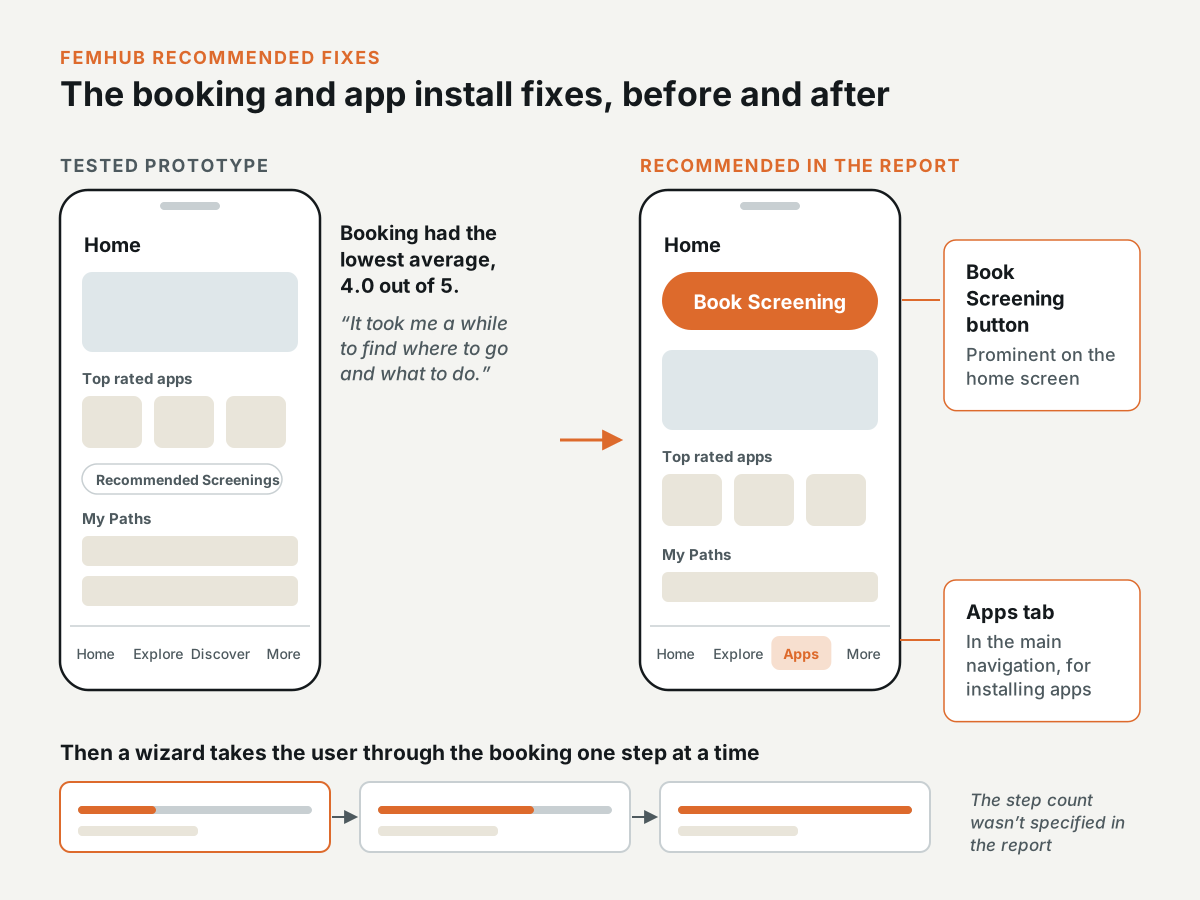
Booking a screening had the lowest average, and in the report I called it the hardest task, with the biggest room for improvement. The other tasks were mostly rated easy, but each one had specific problems.
What participants found hard
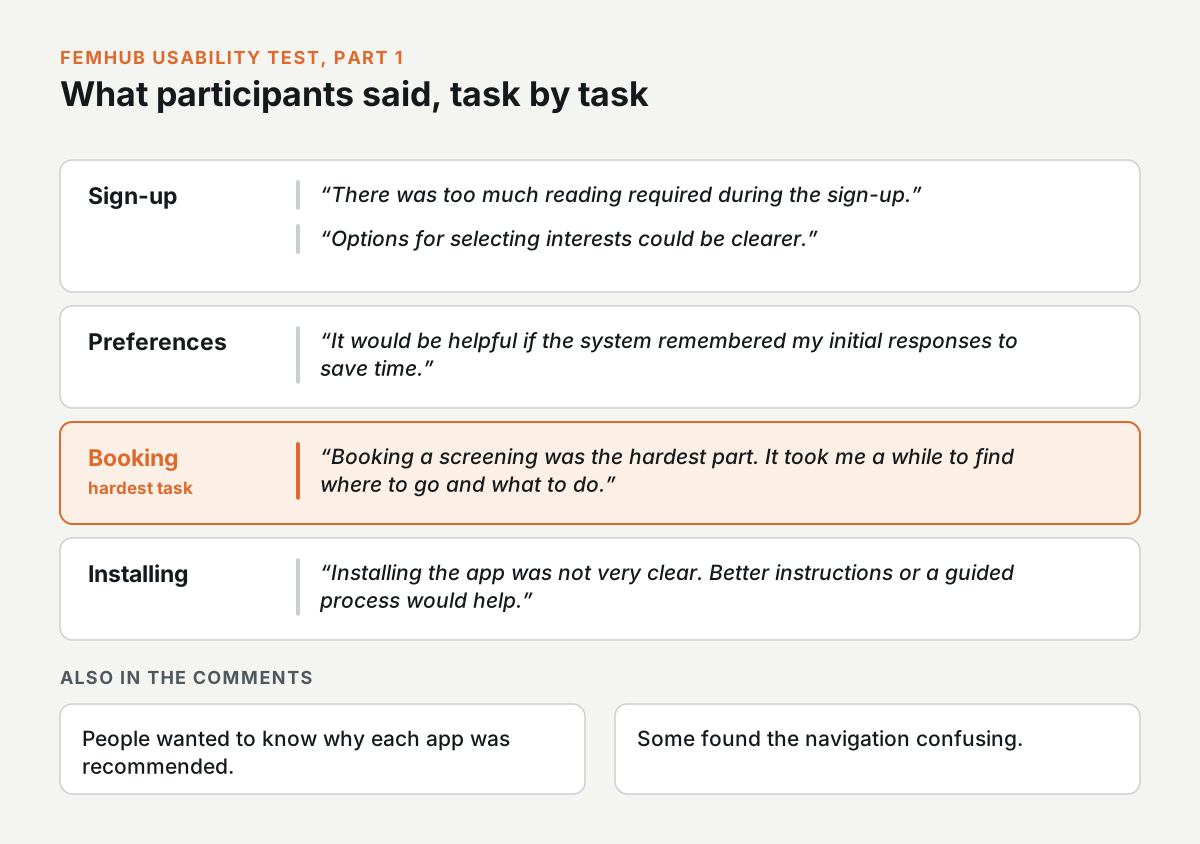
On sign-up, a participant said, "There was too much reading required during the sign-up." Another said, "Options for selecting interests could be clearer." On preferences, one asked for the app to remember their first answers: "It would be helpful if the system remembered my initial responses to save time."
On booking, a participant said, "Booking a screening was the hardest part. It took me a while to find where to go and what to do." On installing, another said, "Installing the app was not very clear. Better instructions or a guided process would help." People also wanted to know why each app was recommended, and some found the navigation confusing.
Recommended fixes and who owned them
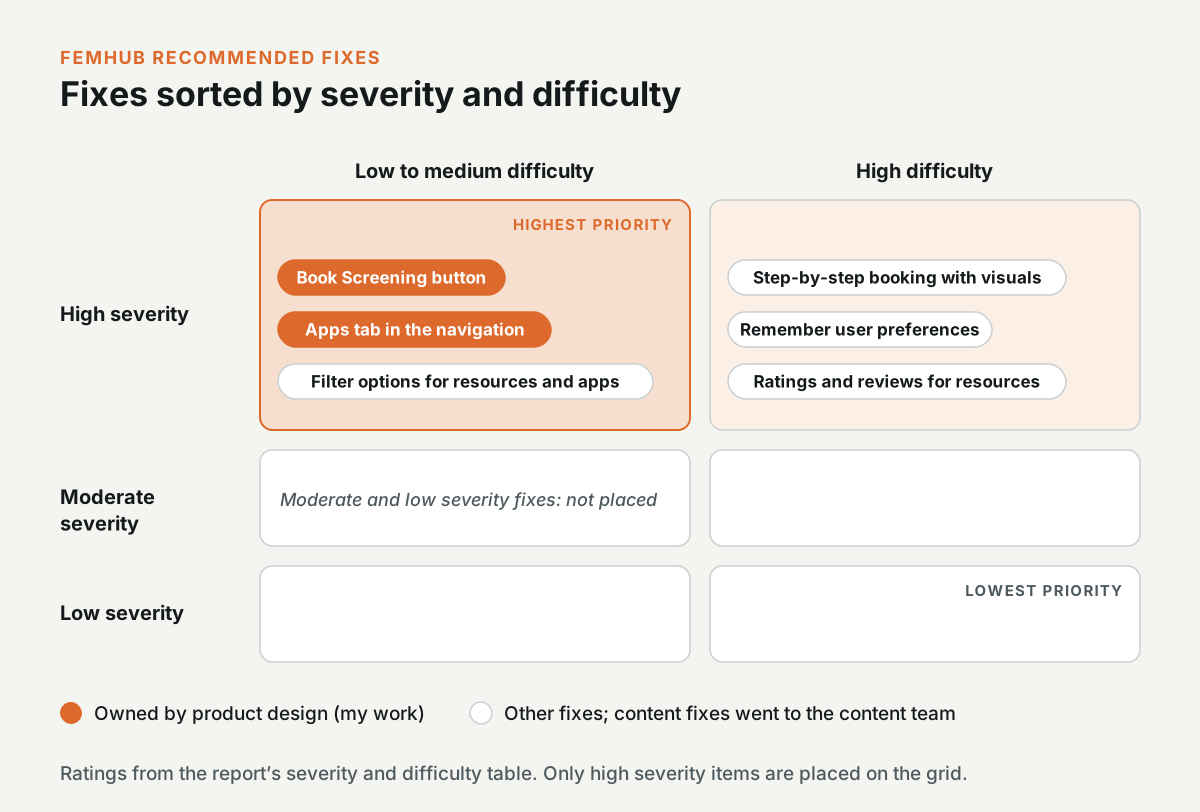
In the report, I recommended a fix for each task. For booking, the recommendation was a prominent Book Screening button on the home screen and a wizard that takes the user through the booking step by step. For installing apps, it was a dedicated Apps tab in the main navigation, with popular apps on the home screen. The other fixes included a Why recommended section for each app, a Recently used preferences section, filter options for resources and apps, and shorter sign-up text in bullet points with icons.
I rated each fix by severity and difficulty and sorted them into six bands, from high severity and low difficulty, the highest priority, down to low severity and high difficulty. The priority lists then gave each fix an owner. The report assigned the Book Screening button and the Apps tab to me as the product design work, with the content fixes going to the content team. One dependency was a list of apps for each condition, which I was going to update in the design.
What happened next with FemHub
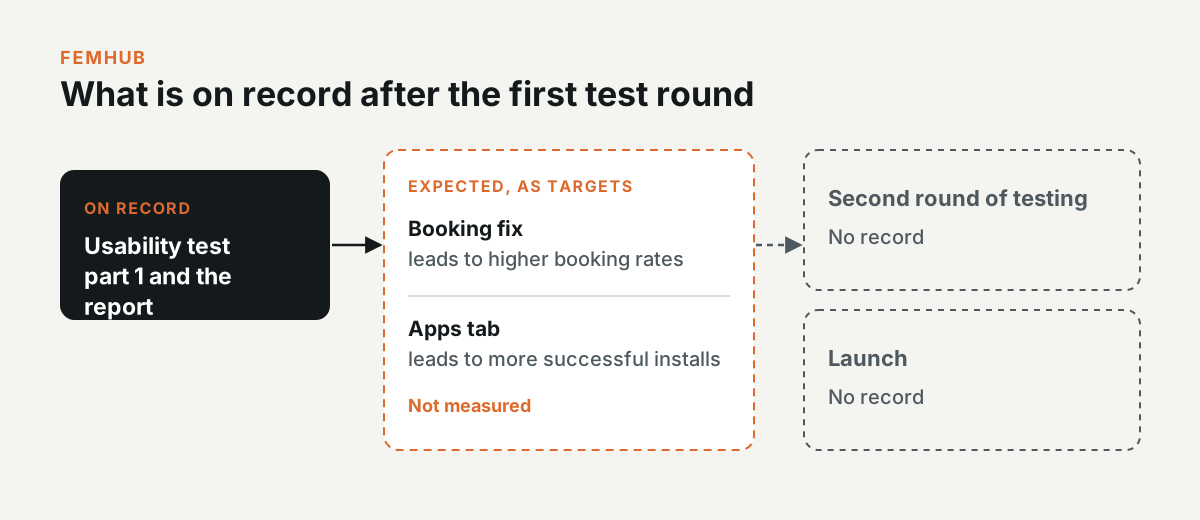
The report was Part 1 of the usability testing. It expected the booking fix to lead to higher booking rates and the Apps tab to more successful installs, but those were targets, and there isn't a second round of testing or a launch on record.
Navigation on Bayer's portal for healthcare professionals
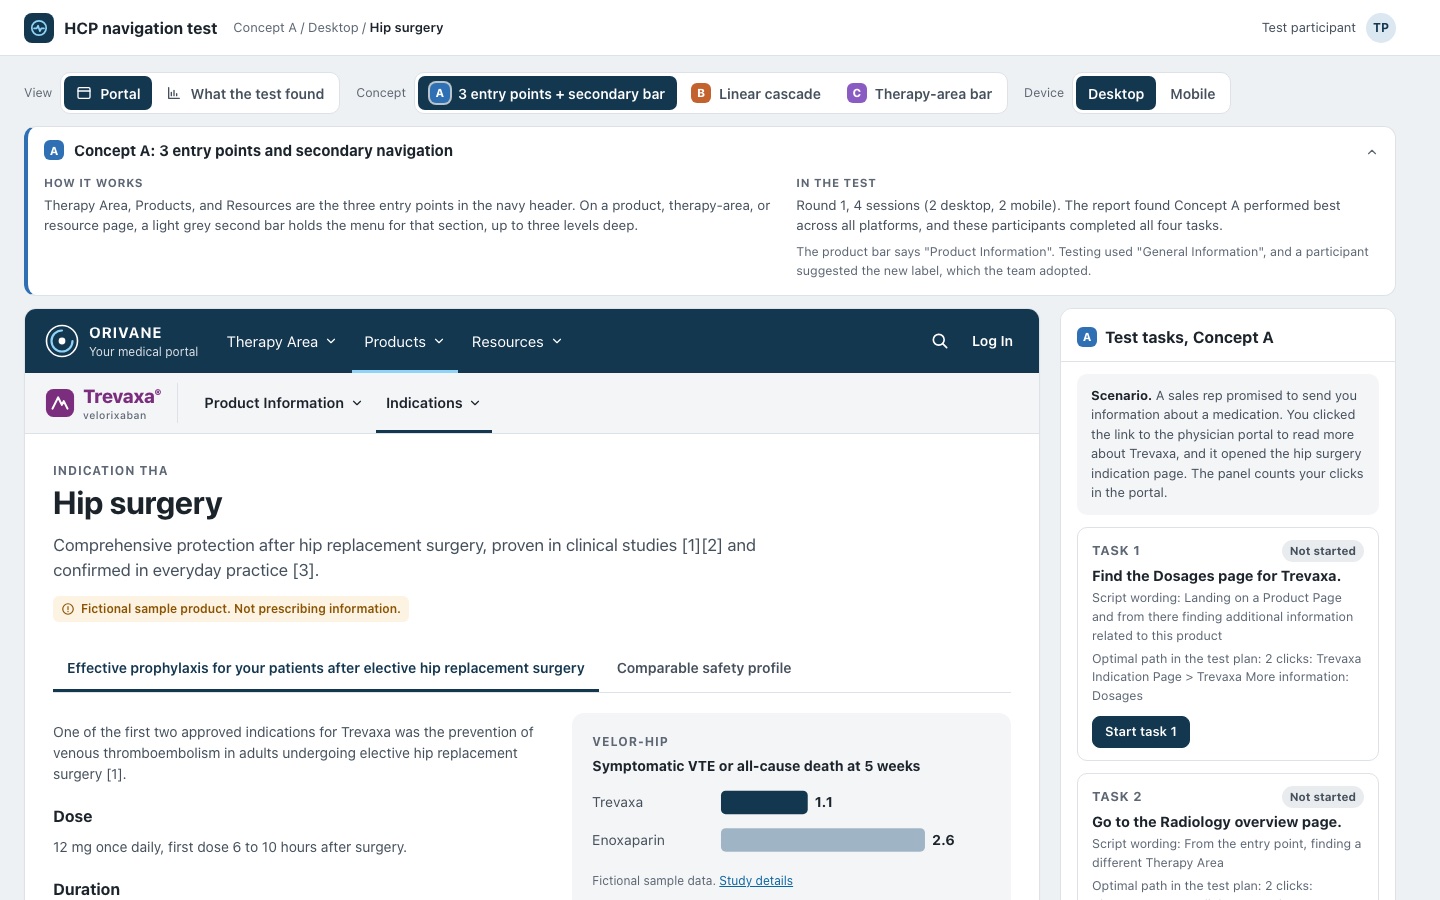
Interactive prototype: Open the prototype. Try this: Show the test tasks and do task 1 in Concept A, then switch to Concept B and do it again.
Bayer runs a portal for healthcare professionals (HCPs), with sections for each therapy area and each product. An earlier UX lab test had shown that the navigation needed to change to meet the HCPs' needs.
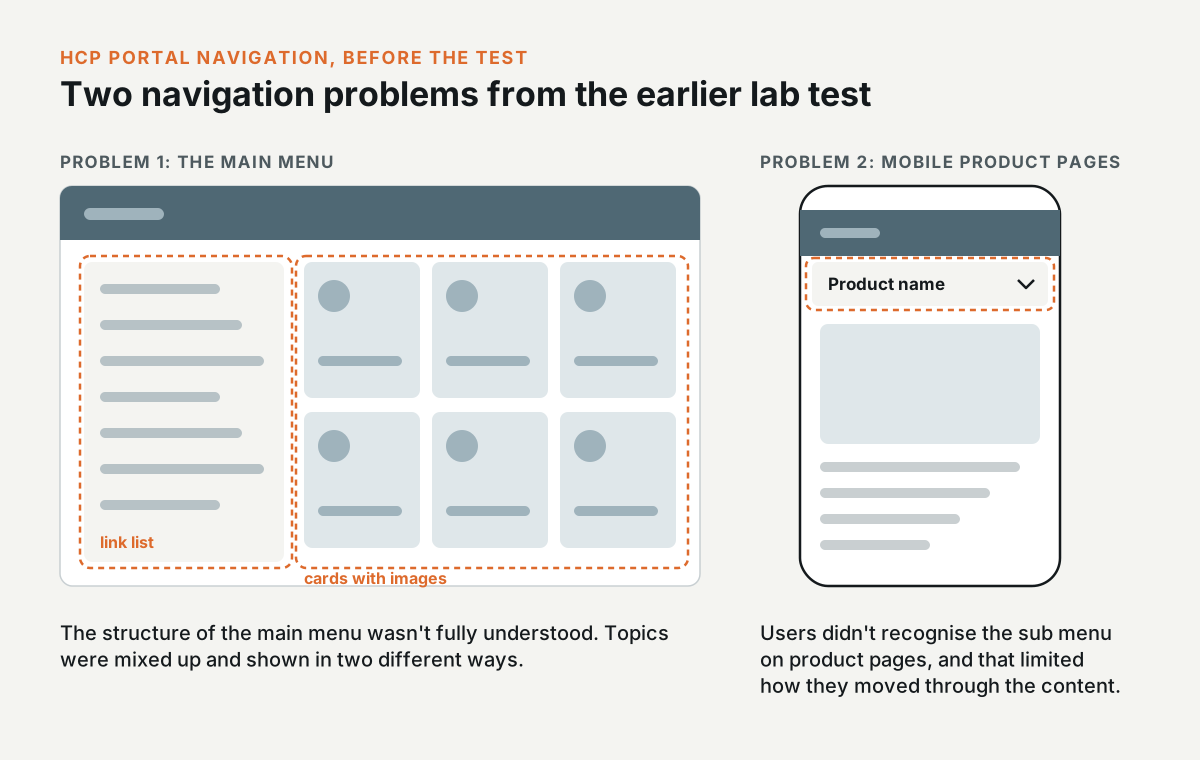
The report described two problems. The structure of the main menu wasn't fully understood, because topics were mixed up and displayed in two different ways, as a link list and as cards with images. On mobile, users didn't recognise the sub menu on the product pages, and that limited how they moved through the content.
What the product owner asked for
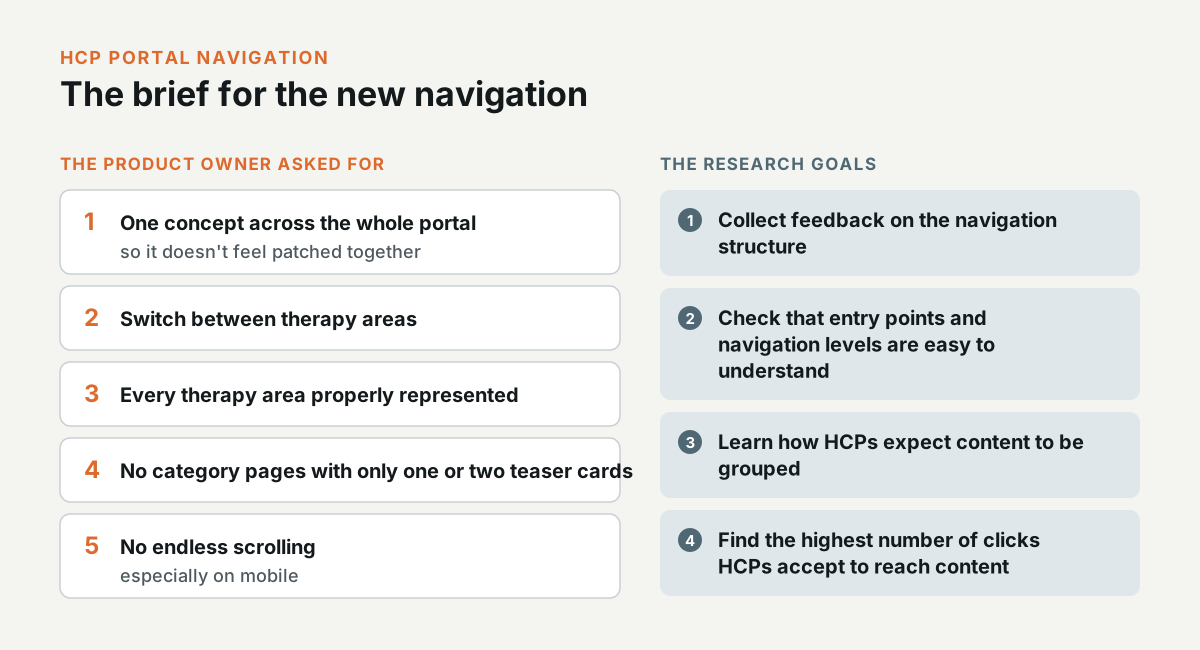
The product owner wanted one navigation concept across the whole portal, so it didn't feel patched together. Users had to be able to switch between therapy areas, and every therapy area had to be properly represented. Navigation items shouldn't lead to category pages with only one or two teaser cards, and the navigation shouldn't need endless scrolling, especially on mobile.
The research goals were to collect feedback on the navigation structure, check that the entry points and the navigation levels were easy to understand, learn how HCPs expect content to be grouped, and find the highest number of clicks they'd accept to reach a specific piece of content.
The three navigation concepts
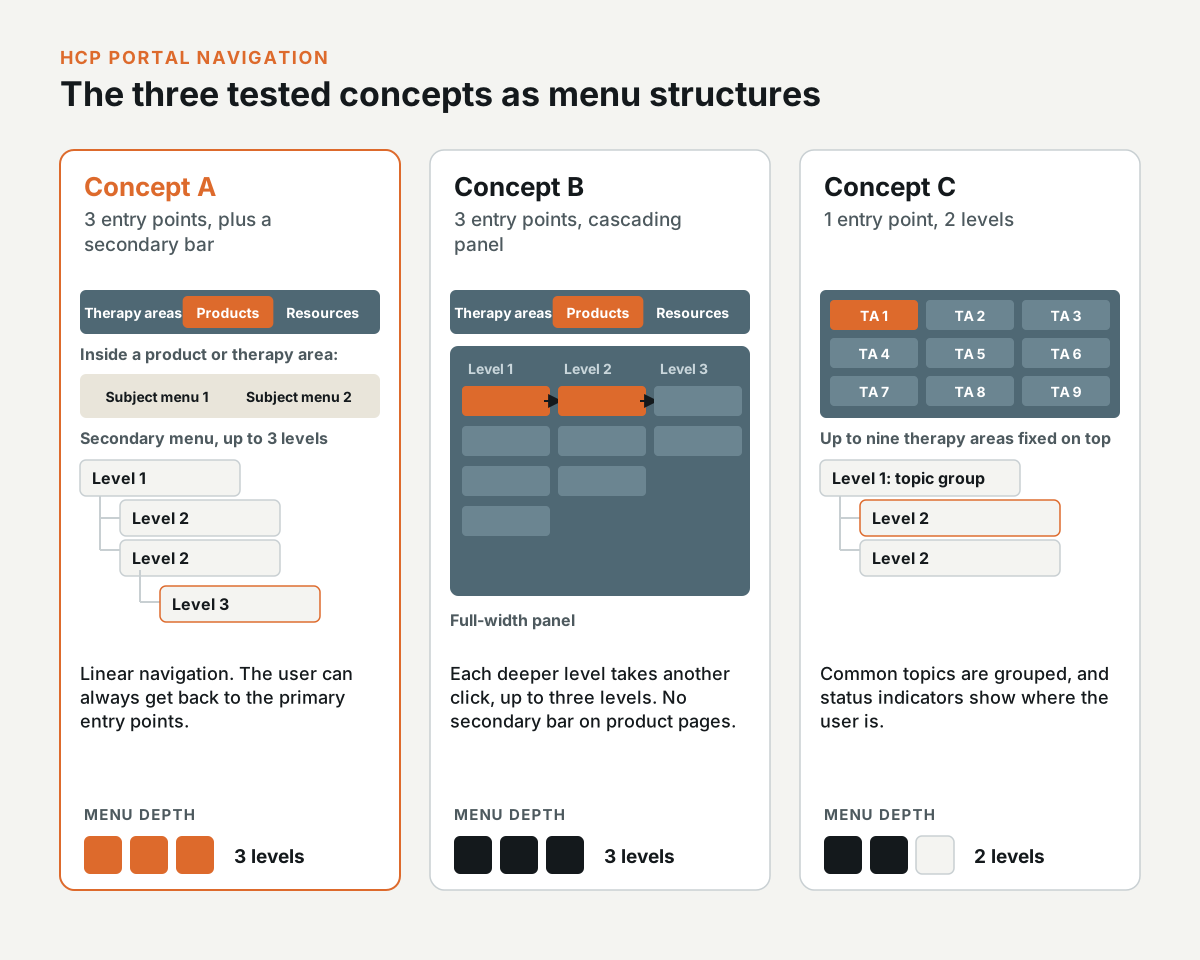
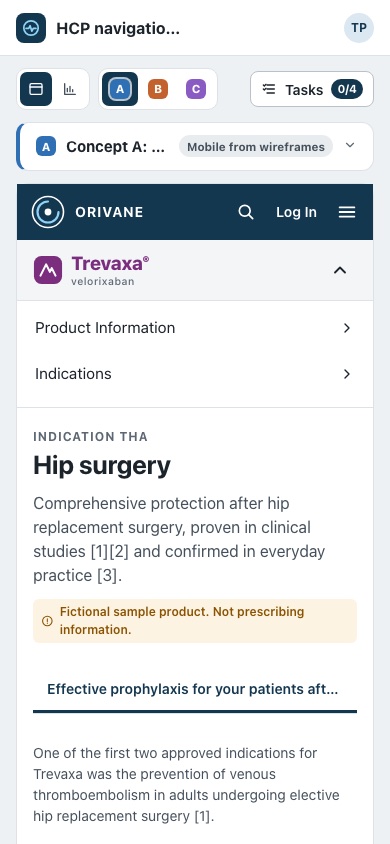
Concept A has three entry points in the primary navigation: therapy areas, products, and resources. When the user is in a product or a therapy area, a secondary navigation bar appears under the header with that subject's own menu, up to three levels deep. The navigation is linear, and the user can always get back to the primary entry points.
Concept B has the same three entry points, but each one unfolds in a full-width panel with cascading columns, up to three levels deep, and each deeper level takes another click. It doesn't have a secondary bar on the product pages.
Concept C has a single entry point for therapy areas, with up to nine items fixed at the top of the page, and the user explores each topic within two menu levels. Common topics are grouped, and status indicators show where the user is in the navigation.
How the navigation test ran
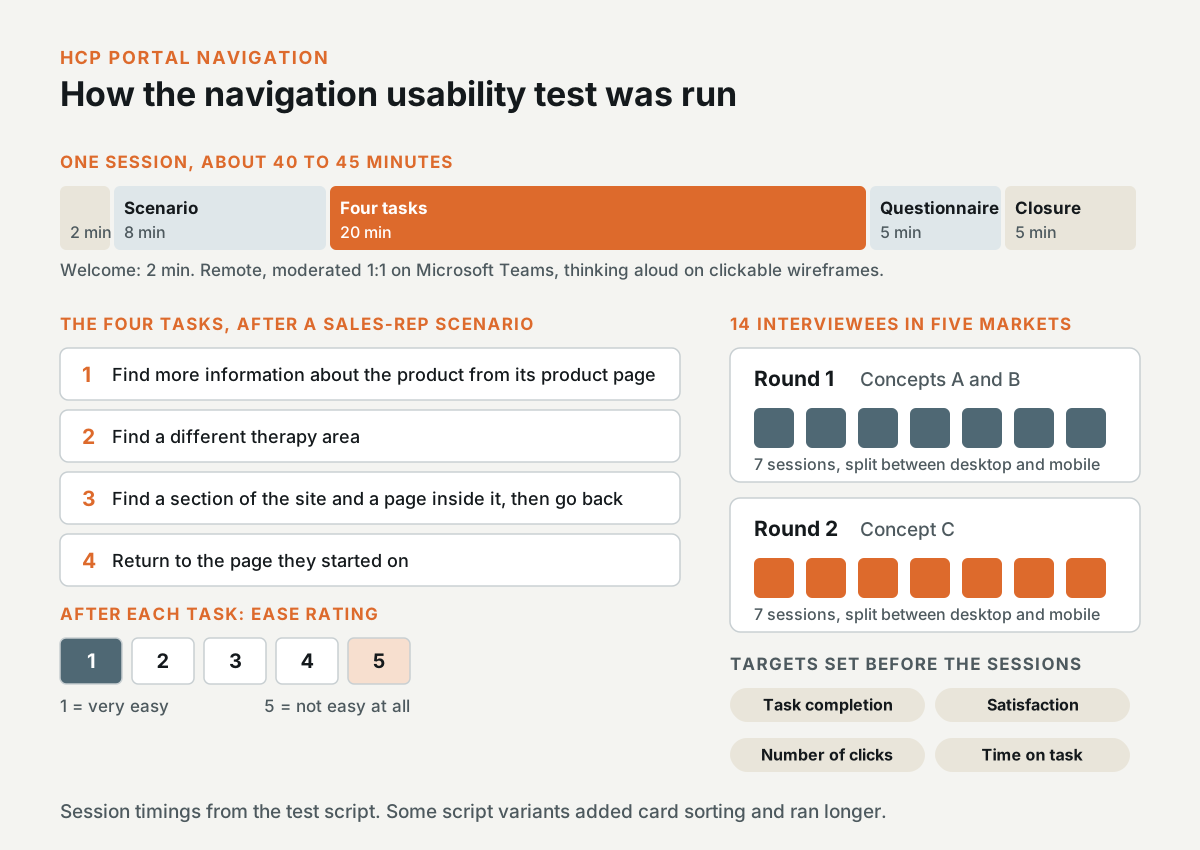
The test was a set of remote, moderated 1:1 interviews on Microsoft Teams. Participants thought aloud while they used clickable wireframes, and a session took about 40 to 45 minutes. A moderator ran each session, and a separate note taker wrote the transcript.
The scenario was that a sales rep had promised to send information about a medication, and the participant followed the general link to the portal to read more about it. They then did four tasks: find more information about the product from its product page, find a different therapy area, find a section of the site and a page inside it and go back again, and return to the page they started on. After each task, they rated how easy it was from 1 (very easy) to 5 (not easy at all).
The report lists 14 interviewees in five markets, mostly Bayer employees with a background as healthcare professionals. The first round of seven sessions tested Concepts A and B, and the second round of seven tested Concept C, with both rounds split between desktop and mobile. Before the sessions, the team set acceptance targets for task completion, satisfaction, number of clicks, and time on task.
My part in the navigation test
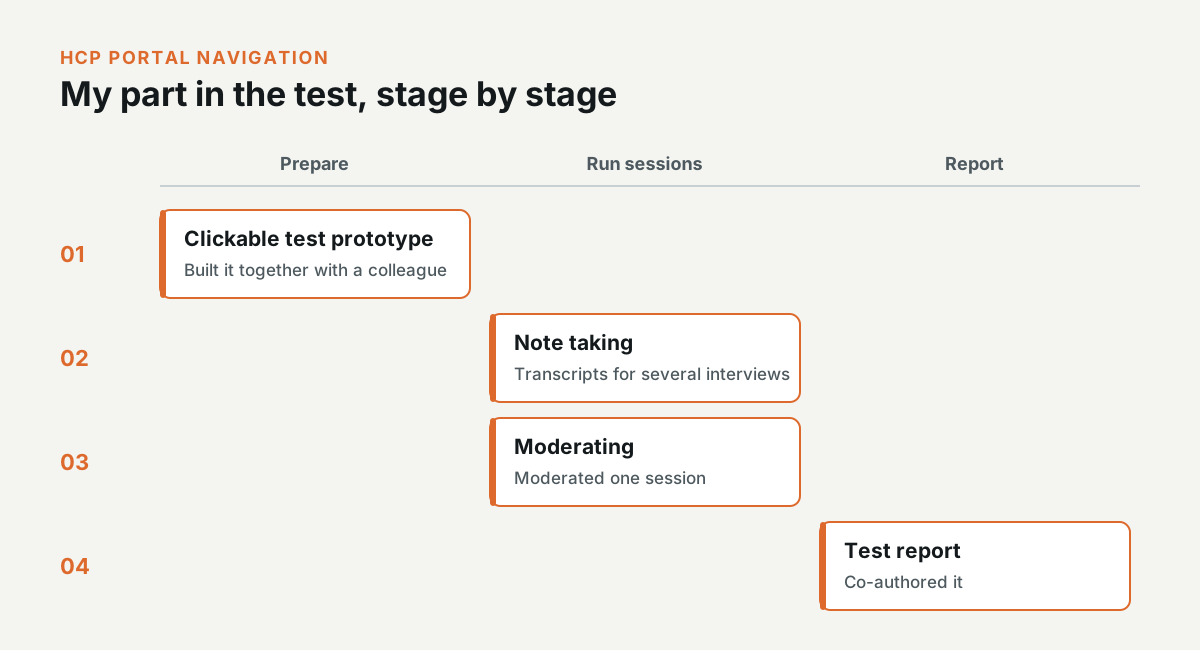
I co-authored the test report, and I built the clickable test prototype together with a colleague. In the sessions, I was the note taker for several interviews, and I moderated one.
What the navigation test found
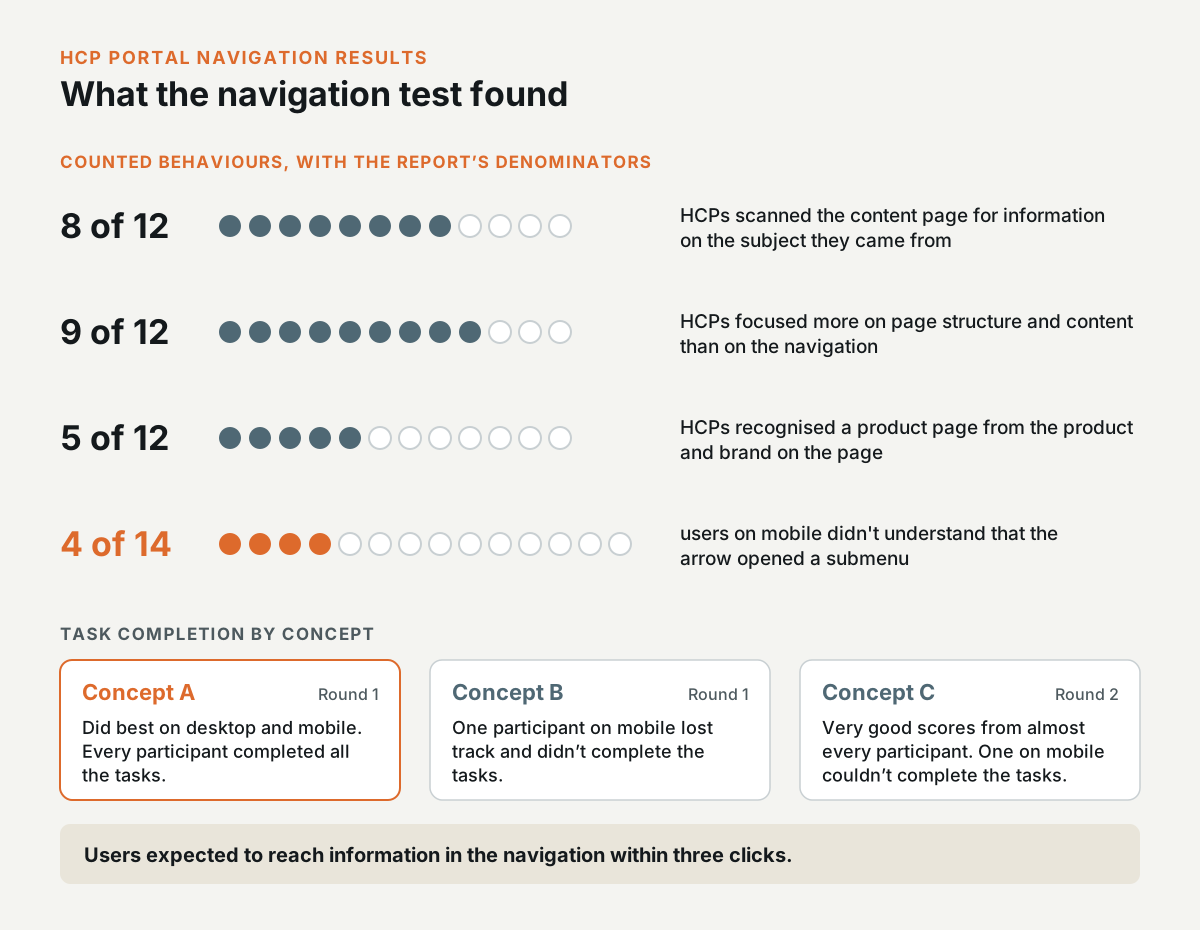
In the first round, Concept A did best on both desktop and mobile, and every participant who tested it completed all the tasks. One participant on the mobile version of Concept B lost track and didn't complete the tasks. In the second round, Concept C got very good scores from almost every participant on desktop and mobile, and one mobile participant couldn't complete the tasks.
The report counted some behaviours. 8 out of 12 HCPs scanned the content page to look for information related to the subject they came from, and 9 out of 12 focused more on the page structure and content than on the navigation itself. Only 5 out of 12 HCPs recognised that they were on a product page from the product and brand on the page. On mobile, 4 out of all 14 users didn't understand that the arrow on the product navigation opened a submenu with more items.
Users expected to reach information in the navigation within three clicks. For Concepts A and C, they all welcomed the second level of navigation, with its menu items grouped by category. Participants also found the Resources label too broad, and some asked for breadcrumbs. They suggested renaming General information in the product bar to Product information, and the team made that change in the later designs.
Recommendations and the planned next steps
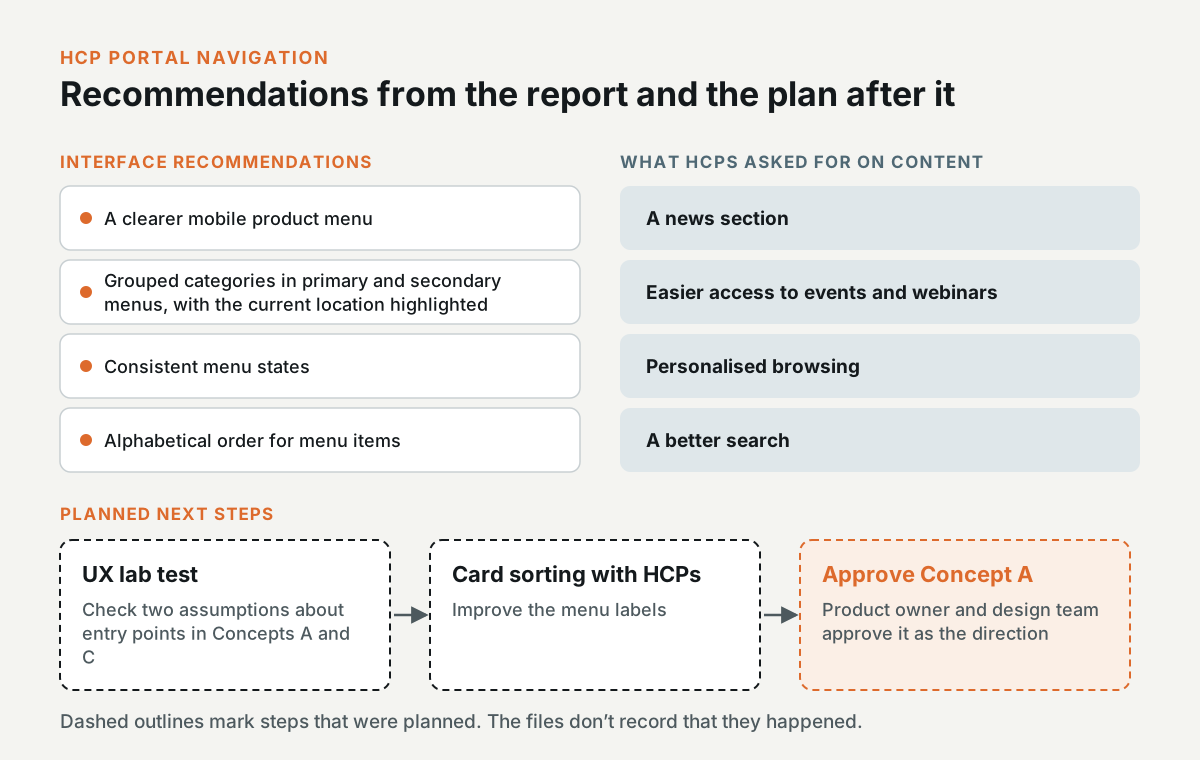
For the interface, the report recommended a clearer mobile product menu, grouped categories in the primary and secondary menus with the current location highlighted, consistent menu states, and alphabetical order for the menu items. On content, HCPs asked for a news section, easier access to events and webinars, personalised browsing, and a better search.
Two assumptions about the entry points in Concepts A and C still needed checking in a UX lab test, and the report suggested a card sorting exercise with HCPs to improve the labels. The next step in the plan was for the product owner and the design team to approve Concept A as the direction.
A patient journey for chronic kidney disease
Interactive journey map: Open the journey map. Try this: Switch to the Caregiver view, then open the COM-B view and select a lever to see the stage it applies to.
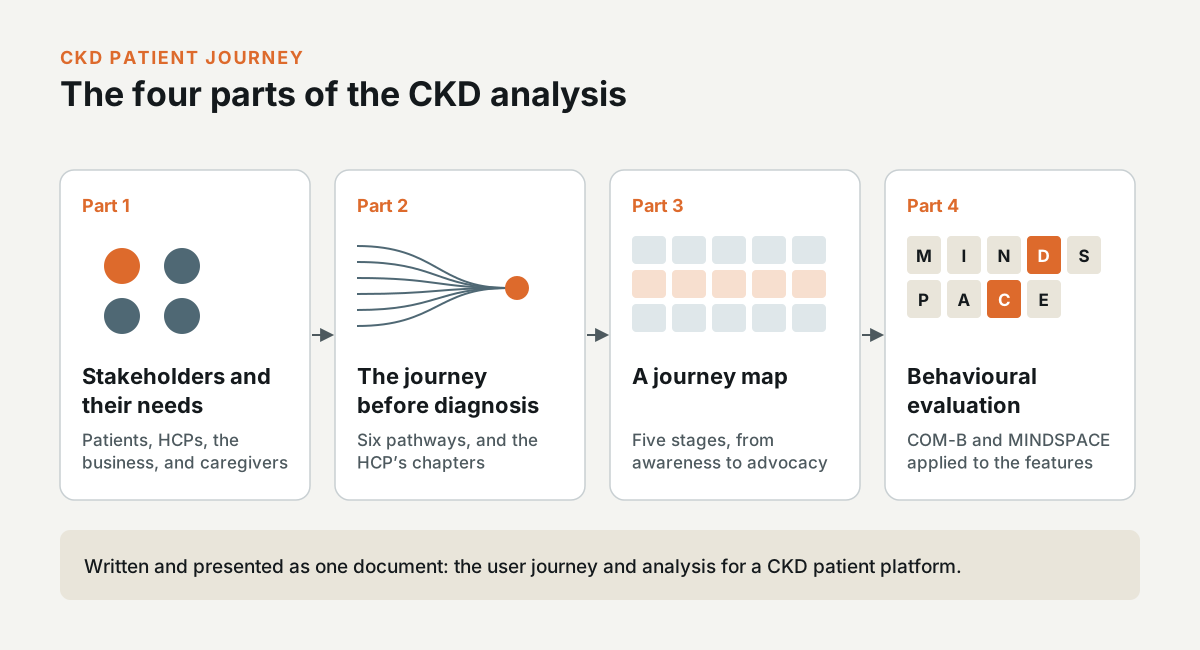
Bayer was working with Cognitant on a digital platform for people with chronic kidney disease (CKD). I wrote and presented the user journey and analysis for the platform. It covers the stakeholders and their needs, the journey before a CKD diagnosis, a journey map, and a behavioural evaluation of the platform's features.
The CKD stakeholders and their needs
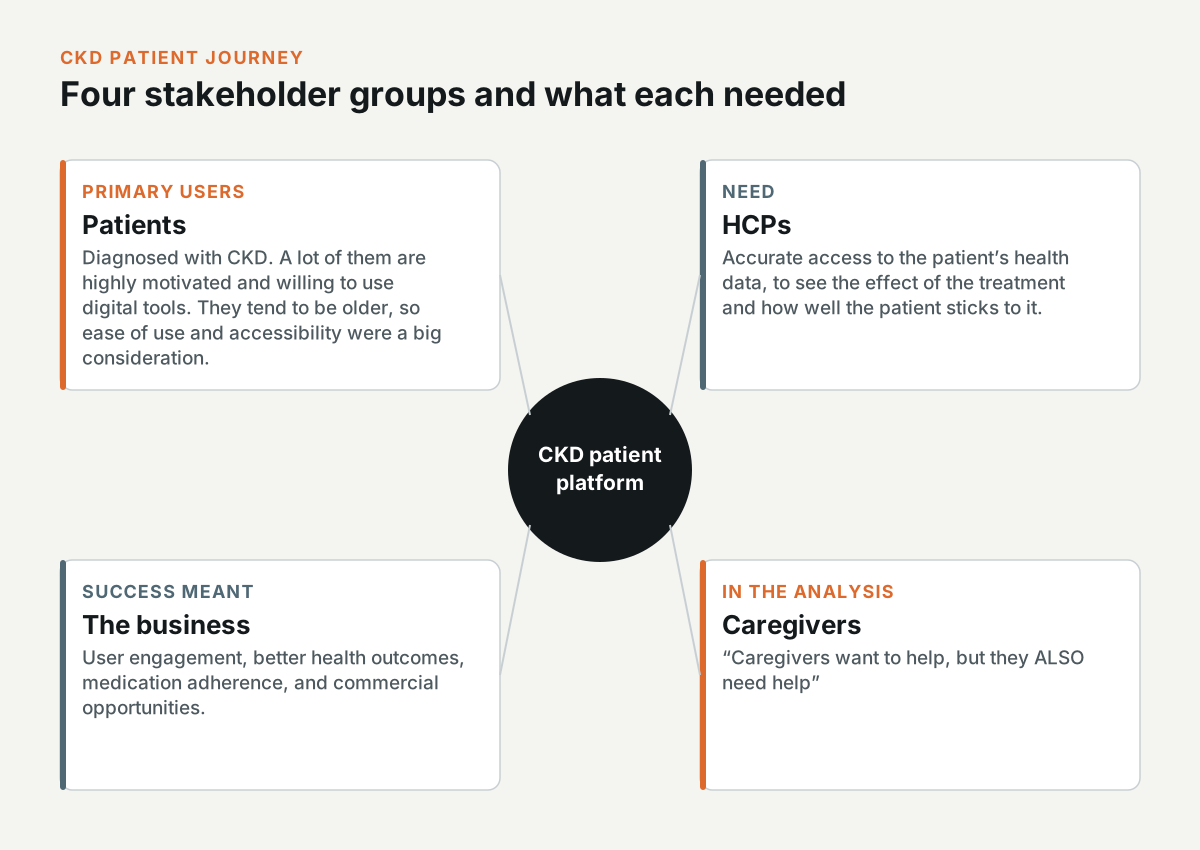
The primary users are patients diagnosed with CKD. A lot of them are highly motivated and willing to use digital tools, but they tend to be older, so ease of use and accessibility were a big consideration. HCPs need accurate access to the patient's health data, to see the effect of the treatment and how well the patient sticks to it.
For Bayer, success meant user engagement, better health outcomes, and medication adherence, as well as commercial opportunities. Caregivers were the fourth group. In the analysis, I put it as "Caregivers want to help, but they ALSO need help".
How patients reach a CKD diagnosis
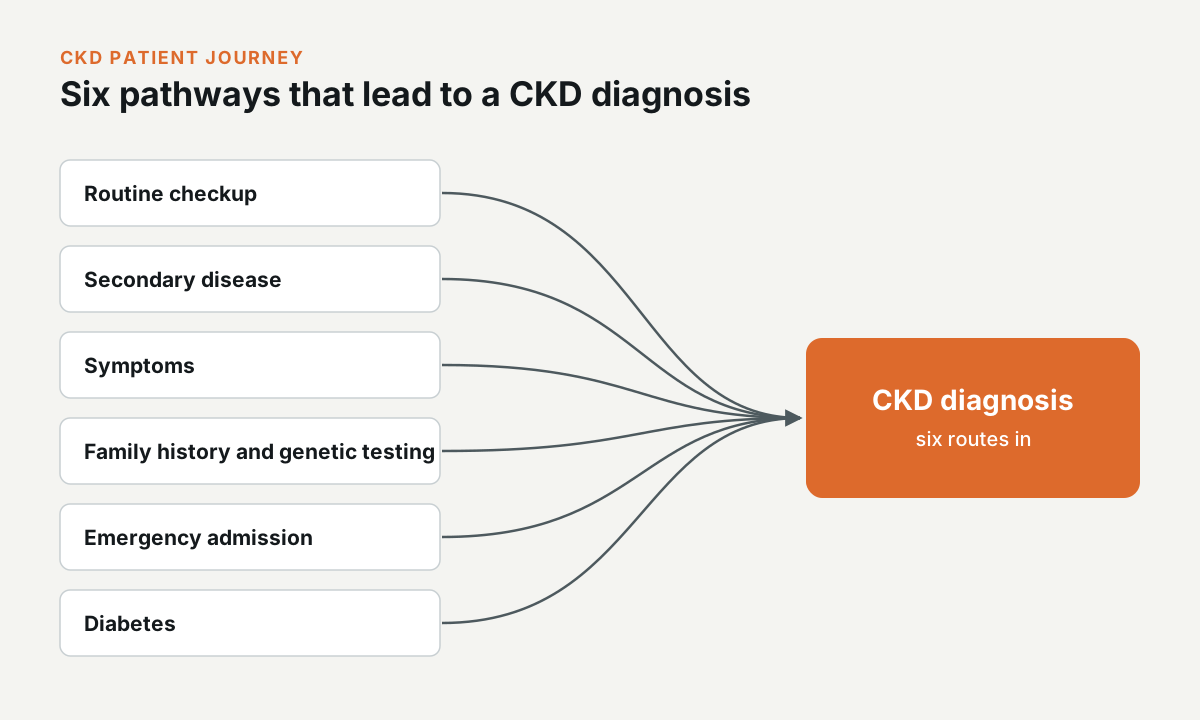
I mapped six pathways to a diagnosis: a routine checkup, a secondary disease, symptoms, family history and genetic testing, an emergency admission, and diabetes.
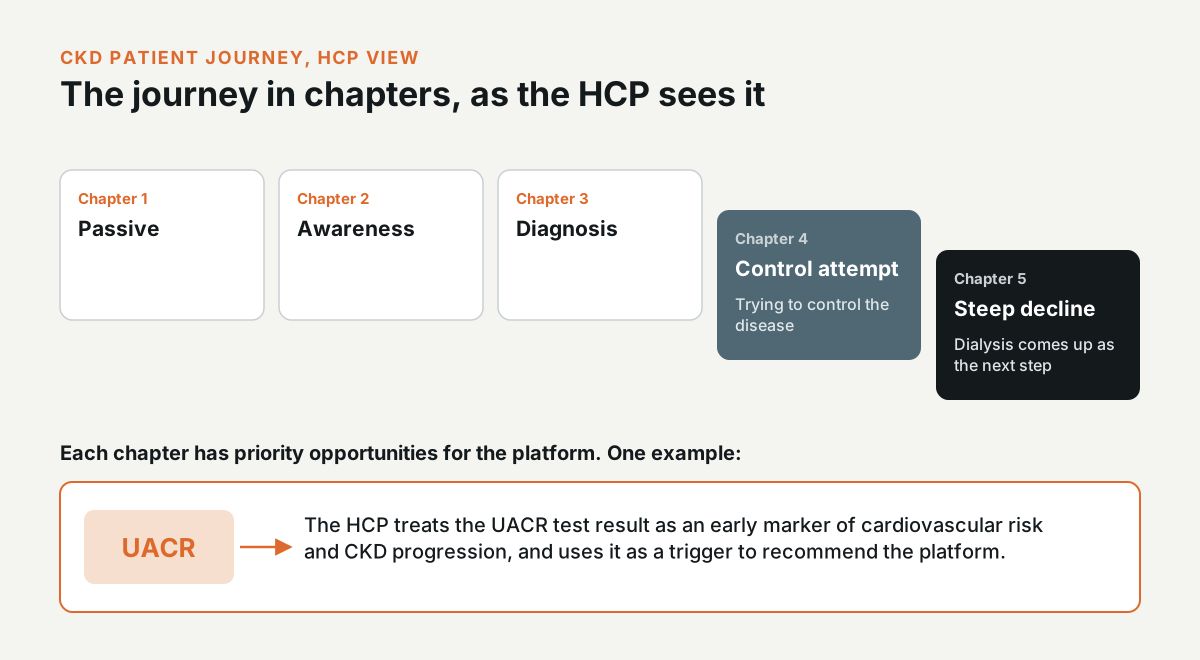
From the HCP's side, the journey runs in chapters, from a passive chapter and awareness, through diagnosis and the attempt to control the disease, to a steep decline where dialysis comes up as the next step. Each chapter has priority opportunities for the platform. For example, the HCP can treat the UACR test result as an early marker of cardiovascular risk and CKD progression, and use it as a trigger to recommend the platform.
The CKD journey map
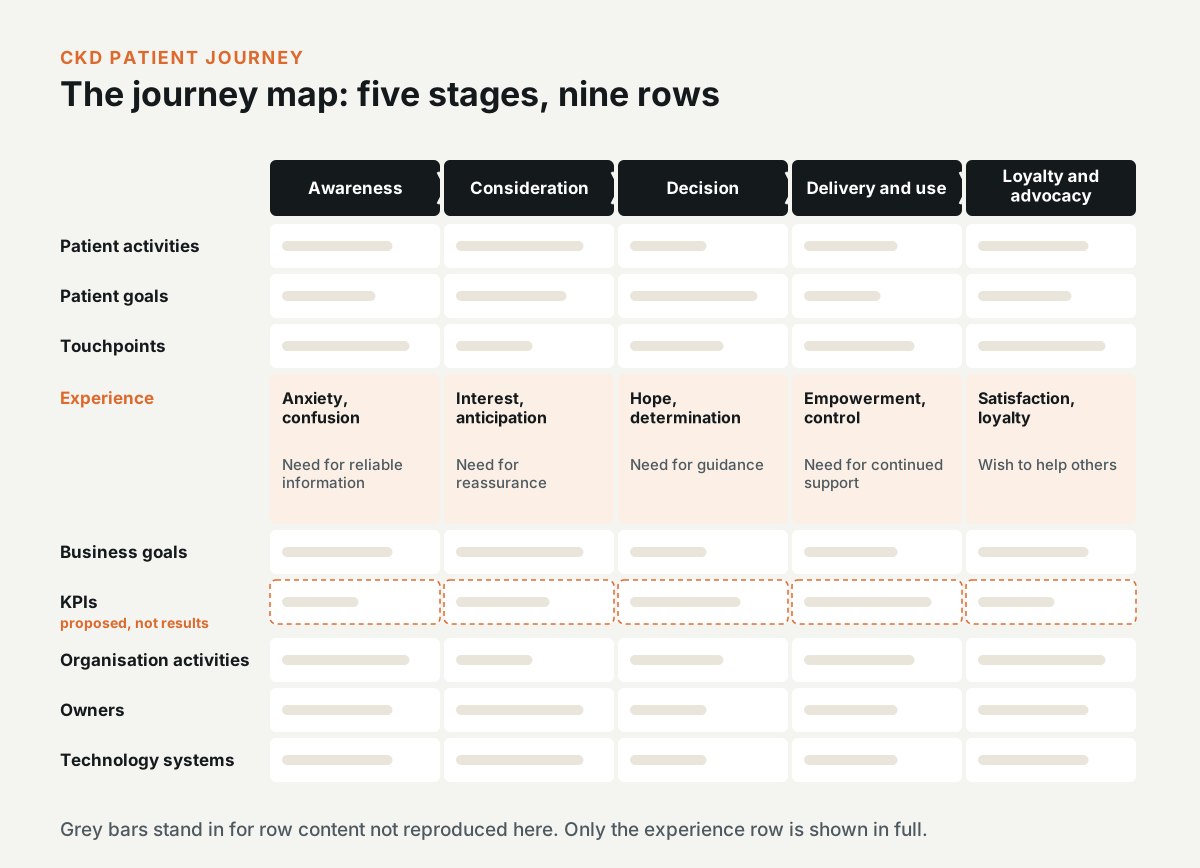
The journey map has five stages: awareness, consideration, decision, delivery and use, and loyalty and advocacy. For each stage, it sets out the patient's activities and goals, the touchpoints, the experience, Bayer's business goals and KPIs, the activities and owners in the organisation, and the technology systems.
The experience row follows the patient's emotions. It starts with anxiety and confusion, with a need for reliable information, and moves through hope and a need for guidance to empowerment and control, and finally satisfaction and a wish to help others. The KPIs in the map, such as the number of active users and retention rates, were proposed metrics for the platform, not results.
Behavioural evaluation with COM-B and MINDSPACE
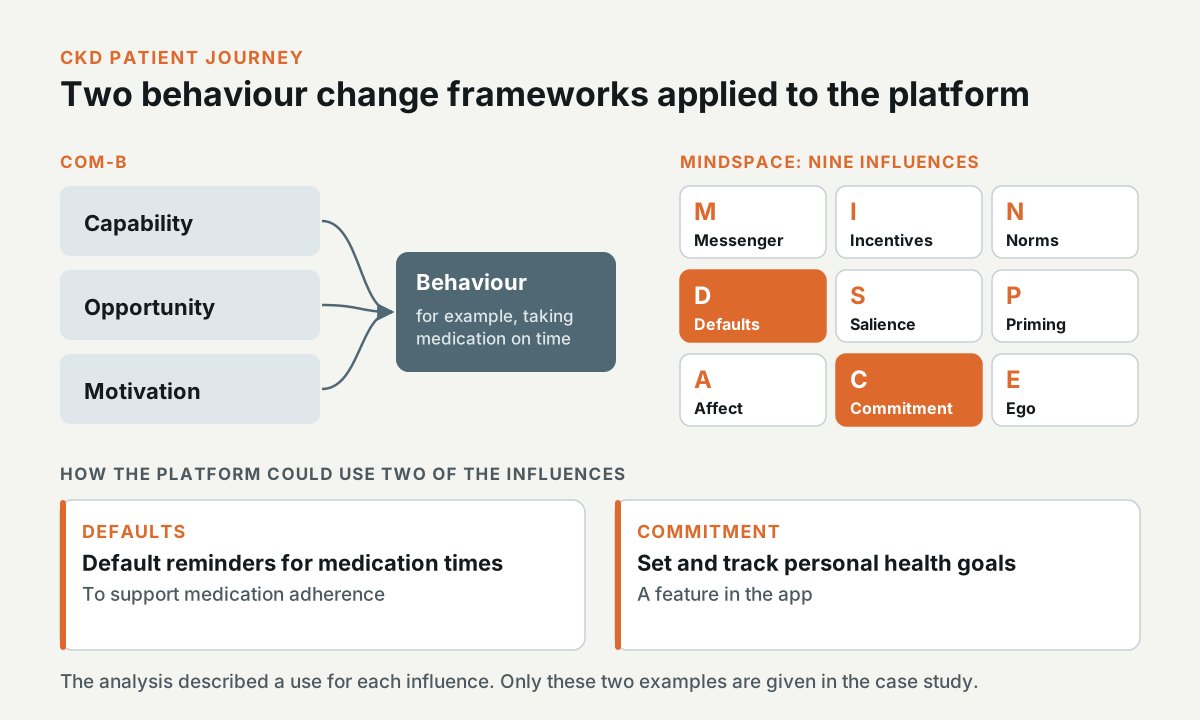
I evaluated the platform with two behaviour change frameworks. COM-B looks at a person's capability, opportunity, and motivation to change a behaviour, such as taking medication on time. MINDSPACE lists nine influences on behaviour, from the messenger and incentives to defaults and commitment.
For each influence, I described how the platform could use it. Under Defaults, for example, the app could set default reminders for medication times to support adherence. Under Commitment, it could have a feature for setting and tracking personal health goals.
Insights from the CKD analysis
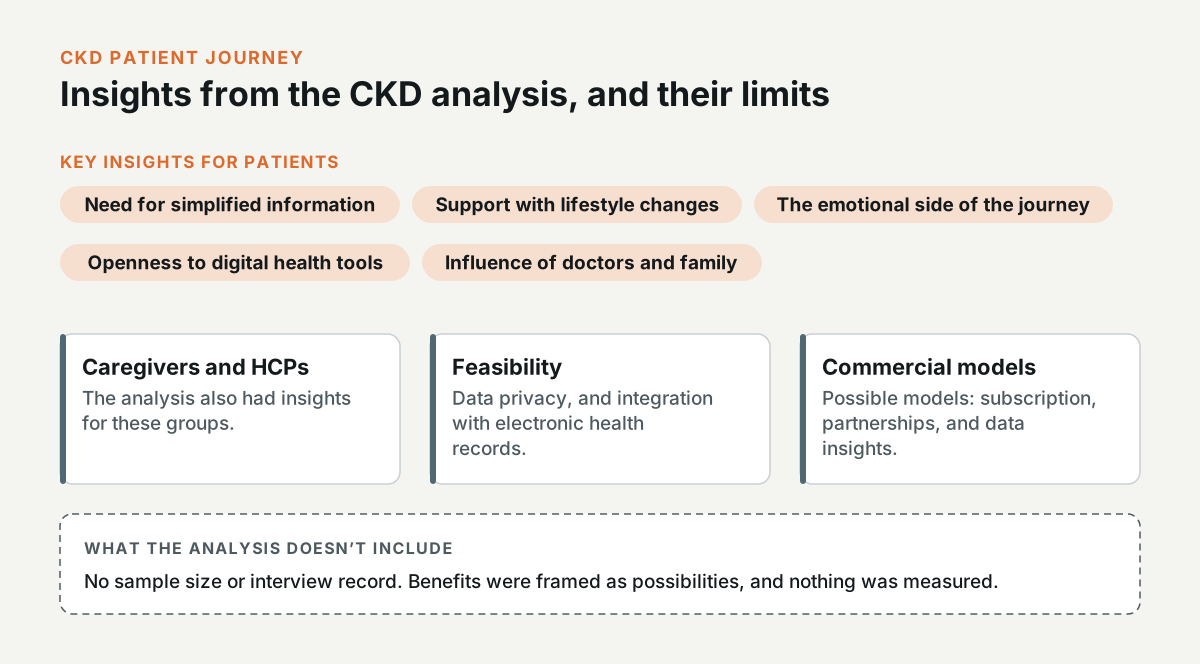
For patients, the key insights were the need for simplified information, support with lifestyle changes, the emotional side of the journey, their openness to digital health tools, and the influence of their doctors and family. The analysis also had insights for caregivers and HCPs. On feasibility, it covered data privacy and integration with electronic health records, and it ended with possible commercial models.
The analysis doesn't include a sample size or an interview record, so I don't give participant numbers for these insights. The benefits were all framed as possibilities, and nothing was measured.
A template for testing AI assistants
Interactive toolkit: Open the toolkit. Try this: Fill in the AI assistant test prep with the first use, then open the UX lab test plan and assign a session.
Teams across Bayer were starting to use AI assistants in functions like marketing and operations, and they needed a way to test if an assistant fit their use case and how to improve it. I wrote a template that collects the detailed information a team needs to prepare a user test of an existing AI assistant.
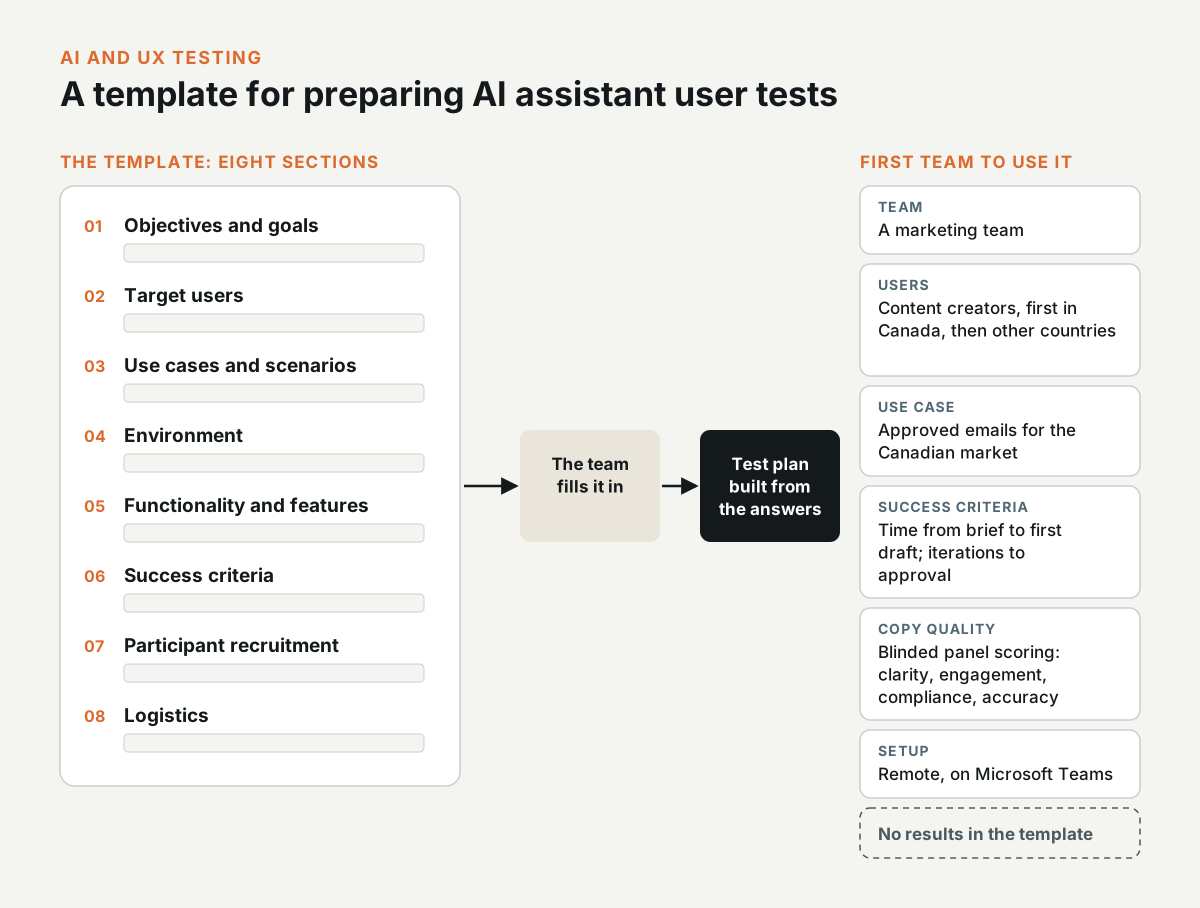
The template has eight sections: objectives and goals, target users, use cases and scenarios, environment, functionality and features, success criteria, participant recruitment, and logistics. The requesting team fills it in, and the test plan is built from their answers.
The first team to use it was a marketing team. They wanted an assistant to help content creators produce approved emails for the Canadian market, starting with a group in Canada and then colleagues in other countries. For success criteria, they listed time from the brief to the first draft and the number of iterations to approval, along with blinded panel scoring of the copy for clarity, engagement, compliance, and accuracy. The testing was going to be remote, on Microsoft Teams, and the completed template doesn't include any results.
Briefing the design team on AI in design
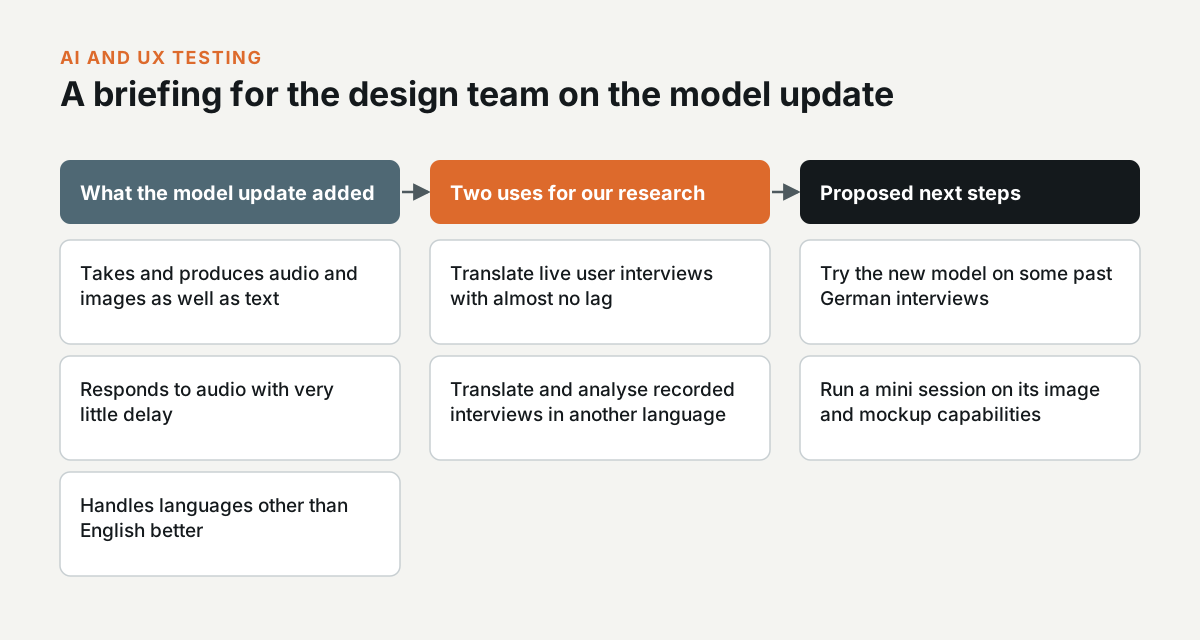
I presented a short briefing to the design team on the new OpenAI model updates. The model could take and produce audio and images as well as text. It also responded to audio with very little delay and handled languages other than English better.
For the team, I focused on two uses: translating live user interviews with almost no lag, and translating and analysing recorded interviews in another language. The next steps I proposed were to try the new model on some past German interviews and to run a mini session on its image and mockup capabilities.
A UX lab test plan for the HCP hub in Germany
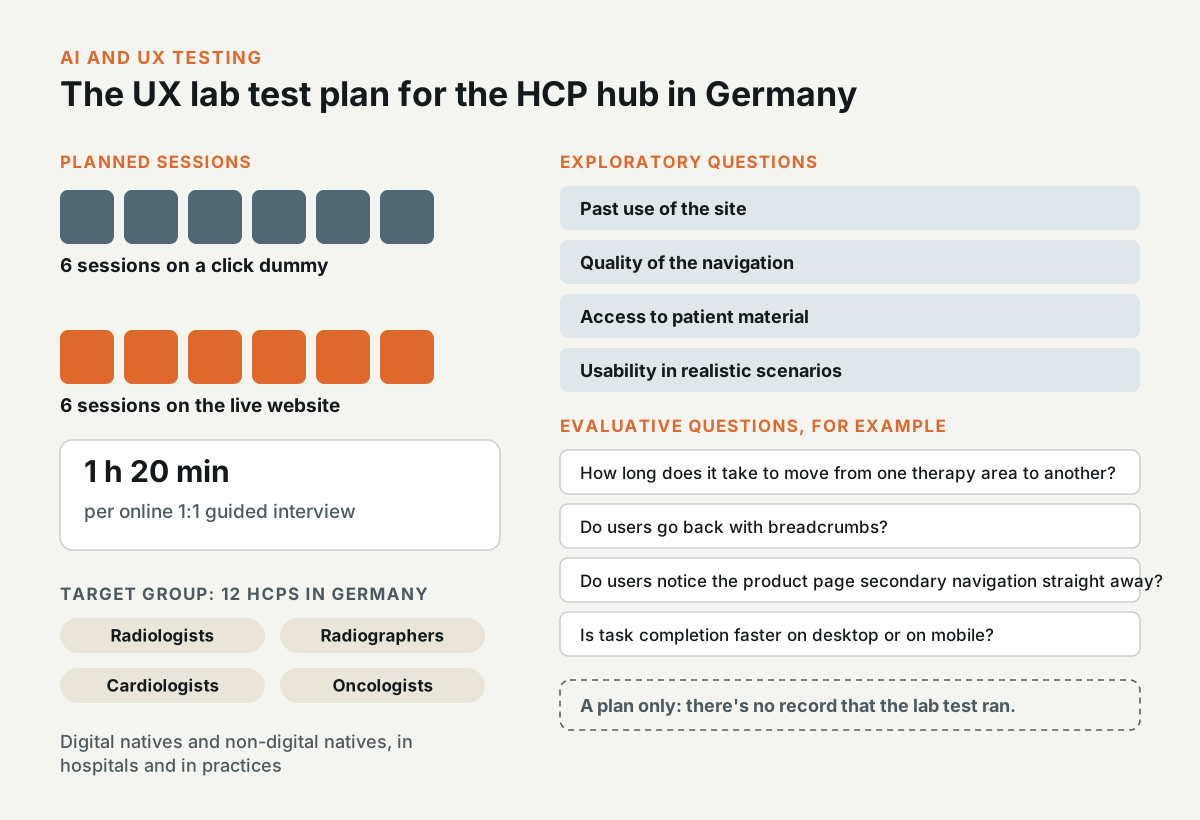
As a follow-up to the navigation test, I wrote the plan for a UX lab test of the HCP hub in Germany. The aim was to guide the development of the website navigation, so it meets the needs of HCPs and they get efficient access to the information they need in their daily practice.
The plan has exploratory and evaluative objectives. The exploratory questions look at how HCPs have used the site before, the quality of the navigation, access to patient material, and usability in realistic scenarios. The evaluative questions include how long it takes users to move from one therapy area to another, if they use breadcrumbs to go back, if they notice the secondary navigation on product pages straight away, and if task completion is faster on desktop or on mobile.
The target group was 12 HCPs in Germany, radiologists, radiographers, cardiologists, and oncologists, with digital natives and non-digital natives in hospitals and in practices. Each session was planned as an online 1:1 guided interview of 1 hour 20 minutes, with six sessions on a click dummy and six on the live website. This was a plan, and I don't have a record that the lab test ran.
Need this level of detail in your product?
Work through the hard product decisions early.
If you’re a product team, that can mean a focused design, system, or prototype project. If you’re hiring, it’s a chance to look closer at how I work across research, interfaces, and code.